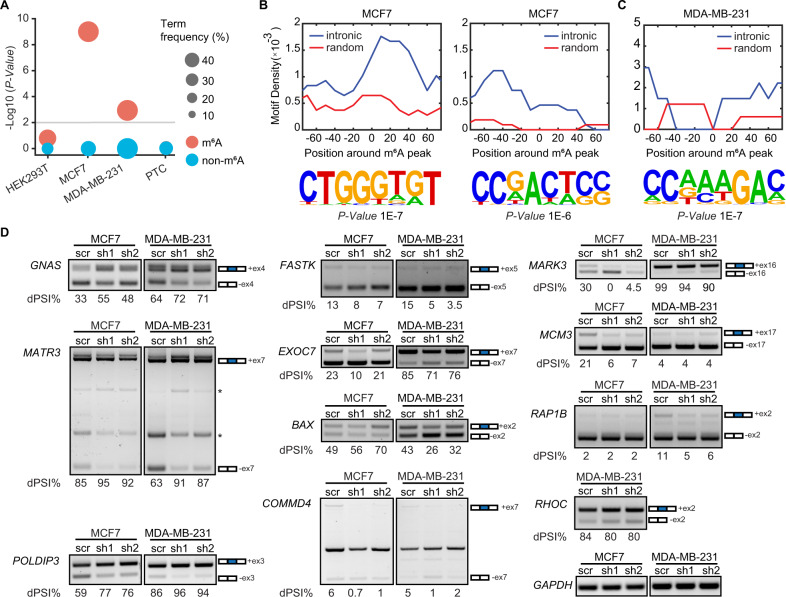
Fig. 4. METTL3 influences AS via m6A deposition.
A Dot plot representing the level of statistical significance of AS transcripts harboring m6A (red) or non-m6A modified AS transcripts (blue), in chromatin-bound transcripts dataset from HEK293T, MCF7, MDA-MB-231, and transcripts with premature termination codons (PTC) dataset from human glioblastoma [48]. The size of the dots is proportional to the frequency of the events. P-value < 0.01, statistically significant. Motif density of m6A peaks in the –80 to +80 nt region around the m6A peak in intronic or random regions (upper panels) and the corresponding HOMER motifs outputs (lower panels) in (B) MCF7 and in (C) MDA-MB-231. D RT-PCR of AS genes in METTL3 knockdown in breast cancer cell lines MCF7 and in MDA-MB-231 cells. The number of the skipped exons are depicted for each transcript. The PSI was calculated in percentage for each gene. Non-specific bands are indicated with an asterisk.

