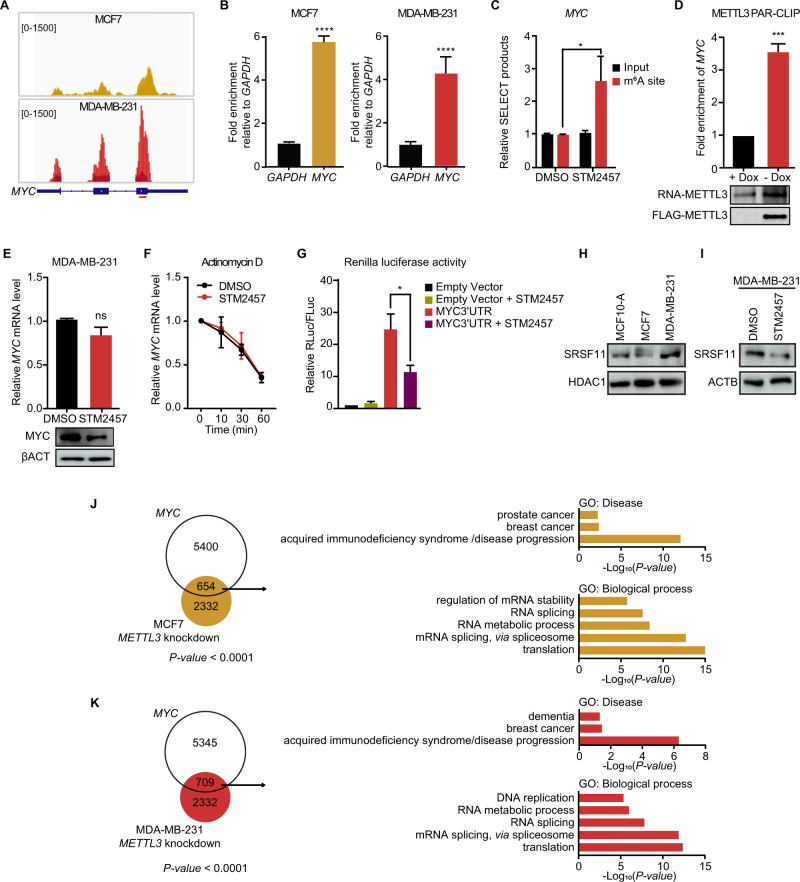
Fig. 5. m6A motifs in MYC 3´UTR promotes the translation of MYC mRNA.
A m6A peak distribution in MYC mRNA in MCF7 (left panel) and MDA-MB-231 (right panel) visualized in IGV. Input reads are represented in darker colors and the enriched RNA immunoprecipitated in yellow (MCF7) or red (MDA-MB-231). The amplified region by qPCR is depicted with a red line below MYC gene body. B RT-qPCR of m6A RNA immunoprecipitation (MeRIP) showing the enrichment of m6A in MYC relative to GAPDH in MCF7 (left) and MDA-MB-231 (right). C Relative level of SELECT products specific to m6A site in MYC 3´UTR, using total RNA from DMSO treated or STM2457 treated MDA-MB-231 cells. D RT-qPCR analysis of MYC after FLAG-METTL3 immunoprecipitation performed in control cells (+Dox) or in cells overexpressing Tet-off FLAG-METTL3 (-Dox) in MDA-MB-231 cells. E RT-qPCR analysis of MYC mRNA (upper panel) and western blot for MYC (lower panel) in MDA-MB-231 upon STM2457 treatment. βACTIN is used as loading control. F RT-qPCR analysis of MYC mRNA after treatment with actinomycin D at the time points 0, 10, 30 and 60 min in MDA-MB-231 control and treated with STM2457. G Relative Renilla luciferase activity of the psiCHECK2-MYC 3´UTR in MDA-MB-231 cells treated with DMSO (control) or with STM2457 for 48 h. Control cells were transfected with psiCHECK2 empty vector. Renilla luciferase activity was measured and normalized to Firefly luciferase. Data are mean ± SEM; n = 3 or 4; ****p < 0.0001; ***p < 0.001; *p < 0.05. In A, D, E, and G P-values were determined by two-tailed t-test; in C P-values were determined by one-tailed t-test. H Western blot showing the overexpression of SRSF11 in MDA-MB-231 in comparison to MCF10-A and MCF7. HDAC1 is used as loading control. I Western blot assessing the expression of SRSF11 in MDA-MB-231 upon STM2457 treatment. βACTIN is used as loading control. J Overlaps between AS events of knockdown of METTL3 in MCF7 and MYC-associated AS events (left panel); P-value < 0.0001. GO analysis of the common genes between AS events between knockdown of METTL3 in MCF7 and MYC-associated AS events (right panel); P-value < 0.05. K Overlaps between AS events of knockdown of METTL3 in MDA-MB-231 and MYC-associated AS events (left panel); P-value < 0.0001. GO analysis of the common genes between AS events in knockdown of METTL3 in MDA-MB-231 and MYC-associated AS events (right panel); P-value < 0.05.

