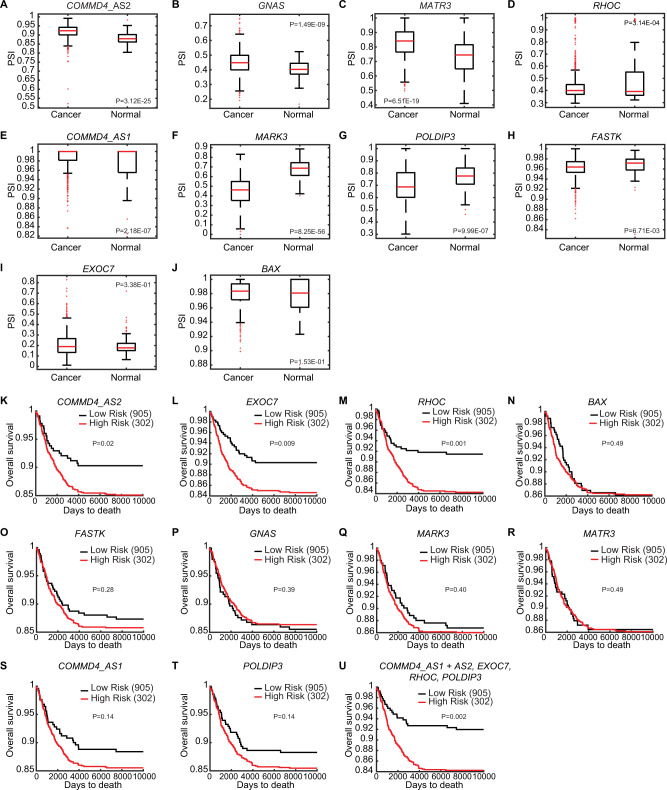
Fig. 6. Identification of breast cancer prognosis-related AS events.
PSI values were analyzed in breast cancer patients (1094 samples) and normal samples (113 samples) for the AS events tested in (A) COMMD4_AS2, (B) GNAS, (C) MATR3, (D) RHOC, (E) COMMD4_AS1, (F) MARK3, (G) POLDIP3, (H) FASTK, (I) EXOC7, (J) BAX. Data were taken from the TCGA SpliceSeq database. Kaplan–Meier plots of overall survival (OS) for breast cancer patients classified according to the AS events expression (low or high) for (K) COMMD4_AS2, (L) EXOC7, (M) RHOC (N) BAX, (O) FASTK, (P) GNAS, (Q) MARK3, (R) MATR3, (S) COMMD4_AS1, (T) POLDIP3. U OS rate for the combination of COMMD4_AS1, COMMD4_AS2, EXOC7, RHOC and PODLIP3. p < 0.05, statistically significant.

