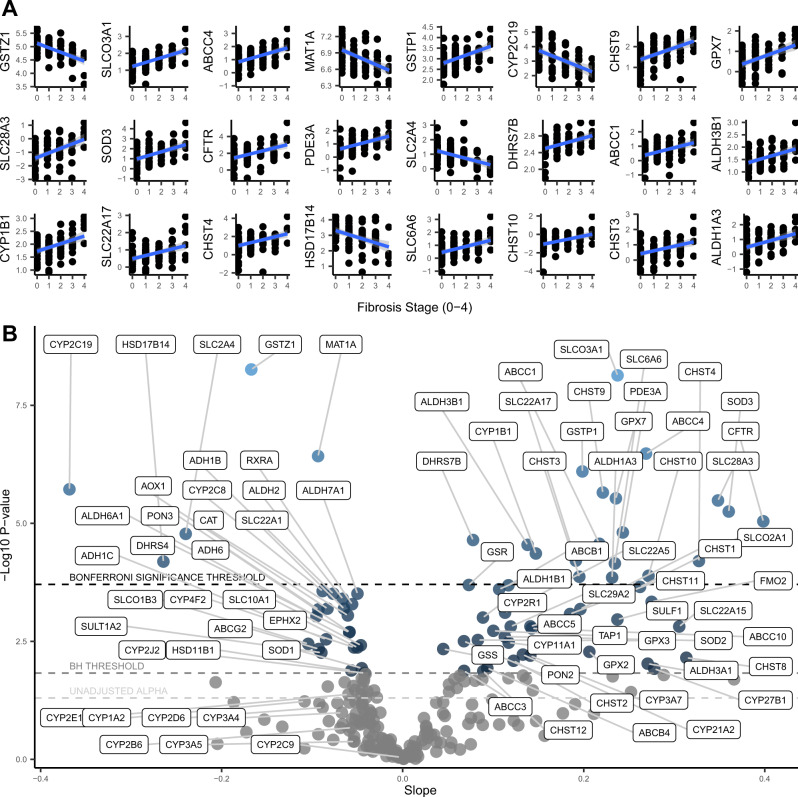
Fig. 3. Regression results for fibrosis stage (n = 87).
A Regression plots of the Bonferroni-adjusted significant correlations between fibrosis stage and pharmacogene mRNA expression. Linear trendlines were fit (blue line) with 95% confidence interval region (grey). B Volcano plot showing the slopes and p-values for the regressions between fibrosis stage and pharmacogene mRNA expression. Horizontal dotted lines correspond to the Bonferroni significance threshold, Benjamini Hochberg (BH) significance threshold, and uncorrected alpha of 0.05, from top to bottom, respectively. Source data are provided in the supplemental materials.

