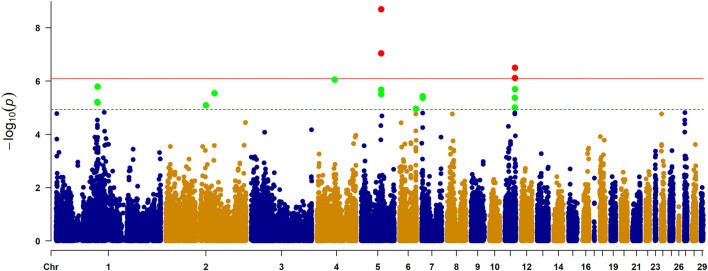
FIGURE 3.
Manhattan plot of genome-wide study association study for the primary feather color trait in ducks. The X-axis represents the genomic position of corresponding SNP and the Y-axis represents −log10-tansformed p-value of the associations. Each dot represents each SNP. The red line represents p-value = 8.03 × 10⁻⁷ (0.05/62,266) for the Bonferroni adjusted genome-wide significance threshold, and blue line represents p-value = 1.61 × 10⁻⁵ (1/62,266) for the Bonferroni adjusted genome-wide suggestive significance threshold. Four genes reaching genome-wide significance were indicated in Manhattan plot, including STARD9, ZNF106, SLC7A5, and BANP.

