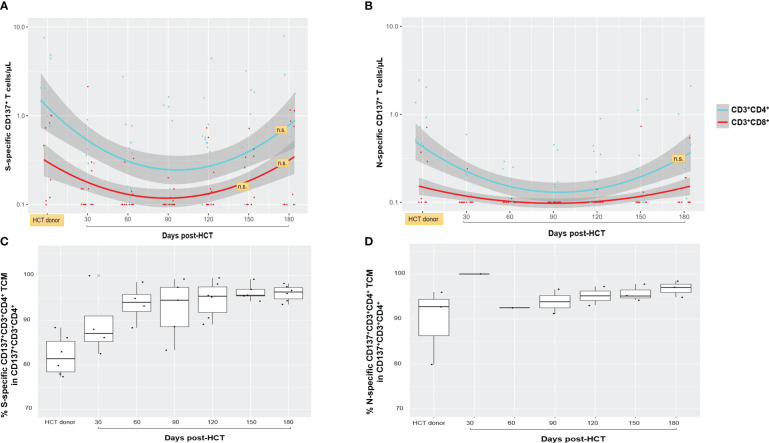
Figure 1.
Spike (S)- and nucleocapsid (N)-specific and functional T-cell responses. (A, B) The frequency of S- and N-specific CD137+CD3+CD4+ (light blue lines and dots) and CD137+CD3+CD8+ (red lines and dots) are shown for nine HCT donors (for six MUD, no PBMC were derived as described in Material and methods; single blood collection at least 30 days before granulocyte colony-stimulating factor for peripheral blood CD34+ cell apheresis collection) and for 15 recipients who had detectable response above the assay detection limit (>0.1 T cells/µl), at the post-HCT time points indicated on the x-axis. The band shown in gray was computed using the Loess scatterplot smoother, providing the marginal geometric mean concentrations (95% confidence) through time for each T-cell subset. Individual measurement trajectories are shown for available PBMC specimens from each participant. T-cell concentrations after post-HCT COVID-19 vaccination or post-HCT COVID-19 diagnosis were not included. Differences between HCT donor and recipient T-cell levels were significant (p < 0.05, calculated by Mann–Whitney U test) unless otherwise indicated (n.s., not significant; orange boxes). N-specific CD137+CD3+CD8+ T-cell levels remained minimal or close to the assay detection limit in both HCT donors and recipients, and statistical comparison was not feasible. (C, D) Box plots showing percentages of S- (C) and N-specific (D) CD137+CD4+ TCM cells in the HCT donor and in the recipients at the post-HCT time points indicated on the x-axis. The box spans the interquartile range, the central bar shows the median, and the whiskers extend to 1.5 times the interquartile range. HCT, hematopoietic stem cell transplant; S, spike; N, nucleocapsid; TCM, central memory T cells.

