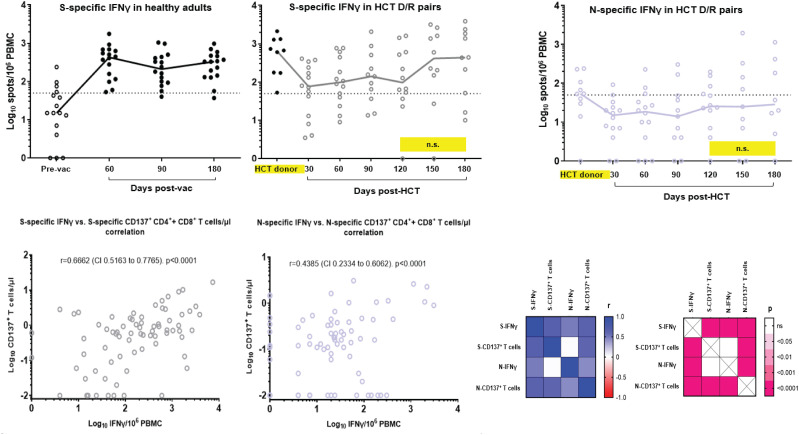
Figure 2.
SARS-CoV-2-specific IFN-γ production and Th1 response correlative analyses. Upper panel, S-specific IFN-γ were measured by ELISPOT and expressed as spots/106 PBMC in: upper left plot, a reference cohort of healthy adults (COH IRB 20720 observational study of SARS-CoV-2 adaptive immunity after COVID-19 licensed vaccines) before (empty dots) and after BNT162b2 mRNA COVID-19 vaccine, at the days indicated on the x-axis (filled black dots); middle left plot: HCT donor (filled black dots, single blood draw as specified in Figure 1 legend) and recipient (grey empty dots) available PBMC specimens at the days post-HCT indicated on the x-axis. N-specific IFN-γ was measured by ELISPOT and expressed as spots/106 PBMC in available PBMC from HCT donor and recipient pairs (purple empty dots, upper right plot). Black lines indicate median values; individual measurement trajectories are shown for each participant. In the upper middle and right plots, differences between HCT donor and recipient T-cell levels were significant (p < 0.05, calculated by Mann–Whitney U test) unless otherwise indicated (n.s., not significant; yellow boxes). The dashed lines represent the arbitrary threshold for positive response (50 spots/106 PBMC). The total number of recipients analyzed for SARS-CoV-2-specific IFN-γ is N=14. R019 was not tested since the only PBMC vial obtained at each time point for this patient was used for the CD137 and memory phenotype assays ( Figure 1 ). Bottom panel, Spearman’s correlation analysis between S-specific IFN-γ versus CD137+ T-cell (CD137+CD3+CD4+ + CD137+CD3+CD8+) levels (bottom left plot) and N-specific IFN-γ versus CD137+ T-cell (CD137+CD3+CD4+ + CD137+CD3+CD8+) levels (middle bottom plot). Spearman correlation coefficients and p values were calculated and plotted as a matrix (bottom right matrices). All available data obtained at all time points were used for the correlation analyses. Pre-vac, prevaccination; post-vac, post-vaccination; r, correlation coefficient; CI, confidence interval.

