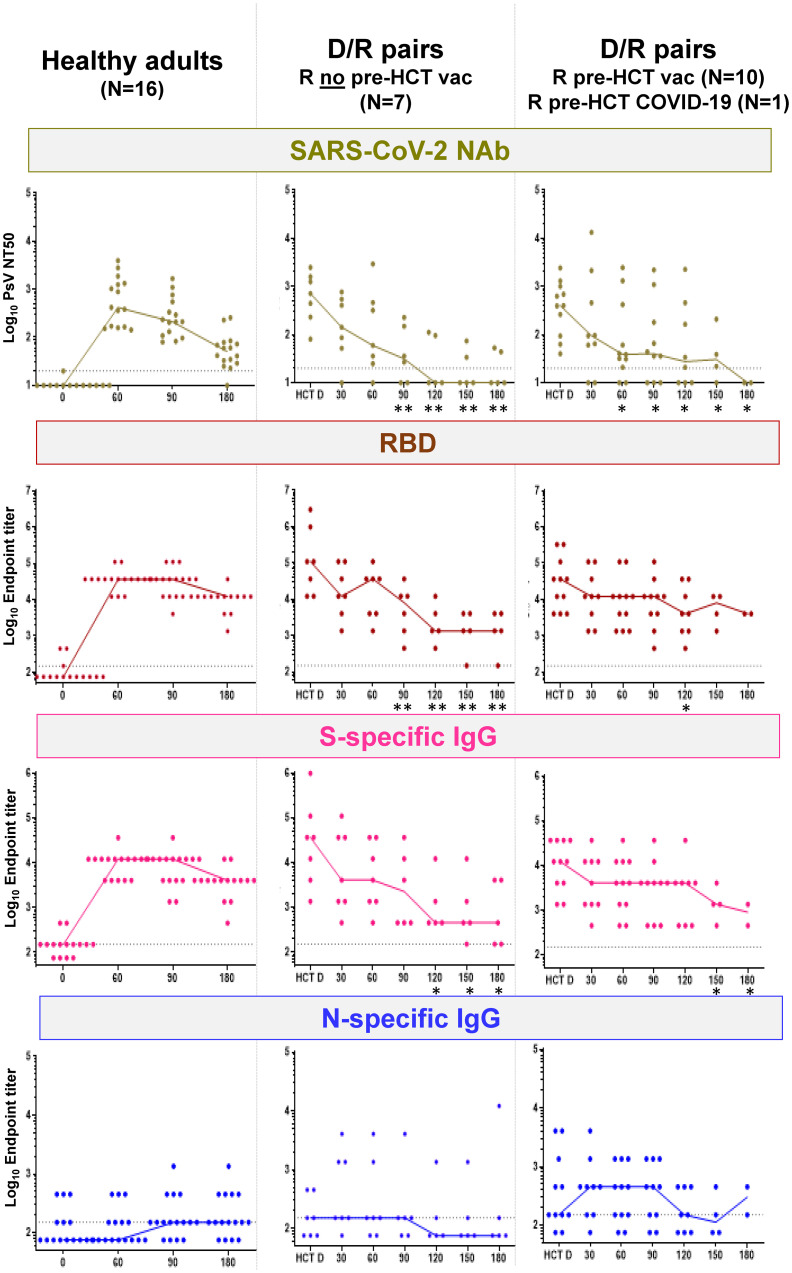
Figure 3.
SARS-CoV-2-specific humoral responses. Left plots, SARS-CoV-2 NAb, RBD, and S- and N-specific IgG (as specified in the top plot banners) in healthy adults before BNT162b2 mRNA COVID-19 vaccine (reported as 0, in the x-axis), and afterwards at the time points shown in the x-axis (days 60, 90, and 180). Middle and right plots, SARS-CoV-2 NAb, RBD-, and S- and N-specific IgG (as specified in the top plot banners) for D/R pairs in whom R did not receive a licensed COVID-19 vaccine before HCT (N = 7; middle plots) and D/R pairs in whom R received a licensed COVID-19 vaccine before HCT (N = 10) or had a history of COVID-19 infection before HCT (N = 1; right plots). In the x-axis, HCT D indicates the donor response in serum obtained at least 30 days before granulocyte colony-stimulating factor for peripheral blood CD34+ cell apheresis collection; time points 30, 60, 90, 120, and 180 indicate the days post-HCT in which recipient serum specimens were analyzed. Star symbols on the post-HCT day indicate that differences in humoral responses (NAb, RBD, and S- and N-specific IgG) between HCT donors and recipients were significant (* p < 0.05 and ** p < 0.01, calculated by Mann–Whitney U test). SARS-CoV-2-neutralizing antibodies (NAb) are expressed on the log10 y-axis as serum dilution that neutralized 50% of the SARS-CoV-2 pseudovirus (PsV NT50). RBD and S- and N-specific IgG were measured using indirect ELISA and are expressed on the log10 y-axis as endpoint titers. Responses at time points after post-HCT COVID-19 vaccination, COVID-19 diagnosis, and administration of COVID-19 monoclonal antibody products were not included in the plots. Specifically, for R who did not receive a licensed COVID-19 vaccine before HCT (middle plots), the following are the sera tested at each time point: day 30, N = 7; day 60, N = 7; day 90, N = 6; day 120, N = 5; day 150, N = 5; and day 180, N = 5. For R who received a licensed COVID-19 vaccine before HCT or had a history of COVID-19 infection before HCT (right plots), the following are the sera tested at each time point: day 30, N = 9; day 60, N = 11; day 90, N = 10; day 120, N = 8; day 150, N = 4; and day 180, N = 2.

