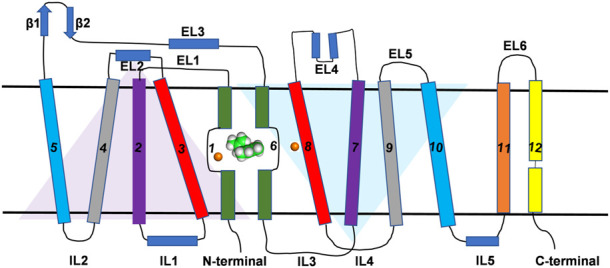
FIGURE 1.

Topological representation of DAT. The TM helices, intracellular loops and extracellular loops are labeled. The orange spheres represent the Na+ ions. Green and white spherical model represents the substrate molecule. Two inverted triangles represent the two domains with an inverted axis of symmetry that contributes to substrate binding pocket.
