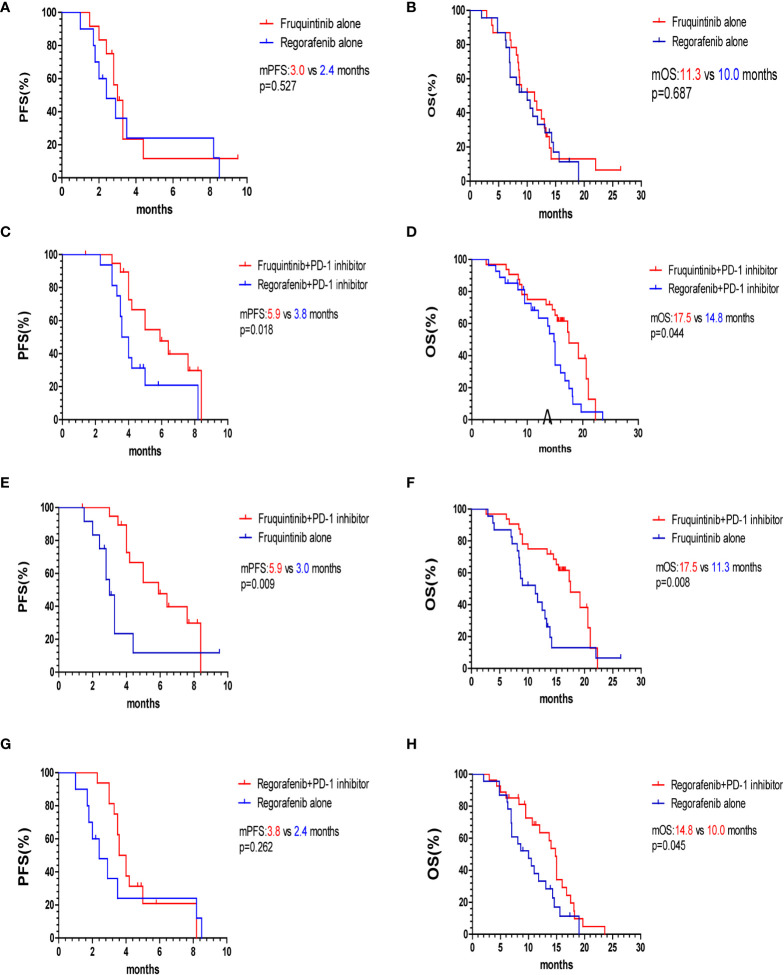
Figure 3.
Kaplan–Meier survival curves of PFS and OS of two subgroups. (A, B) PFS and OS of fruquintinib and regorafenib monotherapy. (C, D) PFS and OS of FP and RP. (E, F) PFS and OS of fruquintinib with or without PD-1 inhibitors. (G, H) PFS and OS of regorafenib with or without PD-1 inhibitors. mPFS, median progression-free survival; mOS, overall survival; PD-1, programmed death receptor-1.

