
Fig. 2.
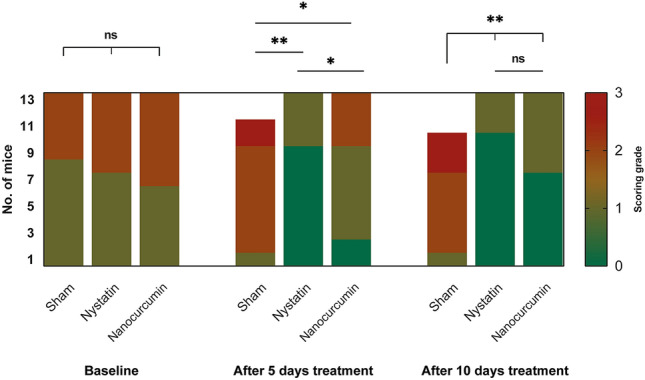
A bar chart showing the comparison between the three studied groups according to clinical scores. Significance is denoted by * for p < 0.05 and ** for p < 0.001, while ns denotes non-statistically significant
Official websites use .gov
A
.gov website belongs to an official
government organization in the United States.
Secure .gov websites use HTTPS
A lock (
) or https:// means you've safely
connected to the .gov website. Share sensitive
information only on official, secure websites.
A bar chart showing the comparison between the three studied groups according to clinical scores. Significance is denoted by * for p < 0.05 and ** for p < 0.001, while ns denotes non-statistically significant