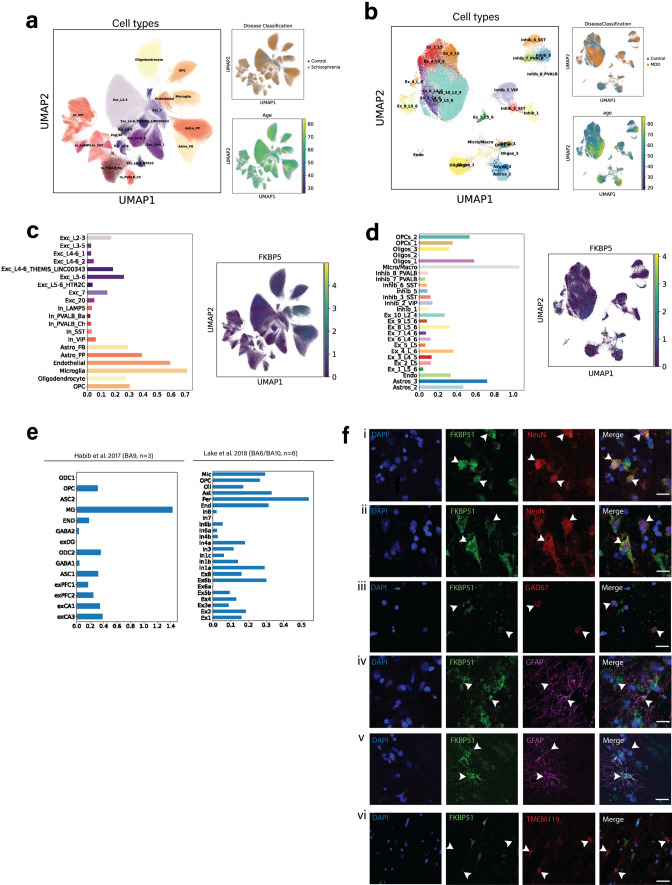
Fig. 3.
Cell-type distribution of FKBP5/FKBP51 expression in the neocortex (BA9, BA10, BA6, BA11). In a Cohort 5 (BA11), and b Cohort 6 (BA9), dimensionality reduction uniform manifold approximation and projection (UMAP) plots depicting total cells across all individuals. The colours indicate the delineated sub-cell type clusters (left of each panel), the distribution of diagnosis across the clusters (top right), and the distribution of age across clusters (bottom right). In c Cohort 5 and d Cohort 6, bar plots show the average FKBP5 gene expression per cell-type cluster, as well as FKBP5 expression across cell clusters. e Bar plots showing the average FKBP5 gene expression per cell type cluster in previously published datasets [20, 38] f Co-localisation of FKBP51 protein expression (green) with nuclear marker DAPI (blue) and (i) NeuN+ neurons (red) in the superficial layer layer; (ii) NeuN+ neurons in the deep layer; (iii) GAD67+ neurons; (iv–v) GFAP+ astrocytes (top showing no colocalization and bottom showing strong colocalization); (vi) TMEM119+ microglia. Scale bar for all images = 20 µm

