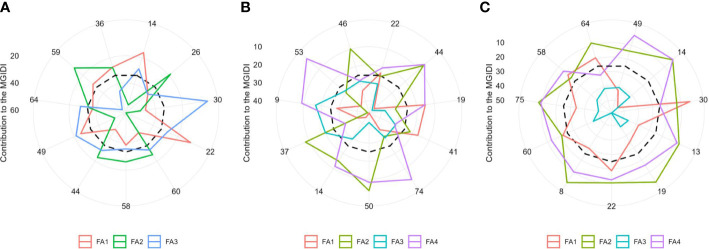
Figure 6.
The strengths and weaknesses view of the selected hybrids is shown as the proportion of each factor on the computed MGIDI values over three soil moisture regimes, namely, (A) optimal, (B) drought, and (C) waterlogging. The smallest the proportion explained by a factor (closer to the external edge), the closer the traits within that factor are to the ideotype. The dashed line shows the theoretical value if all the factors had contributed equally.

