
Figure 1.
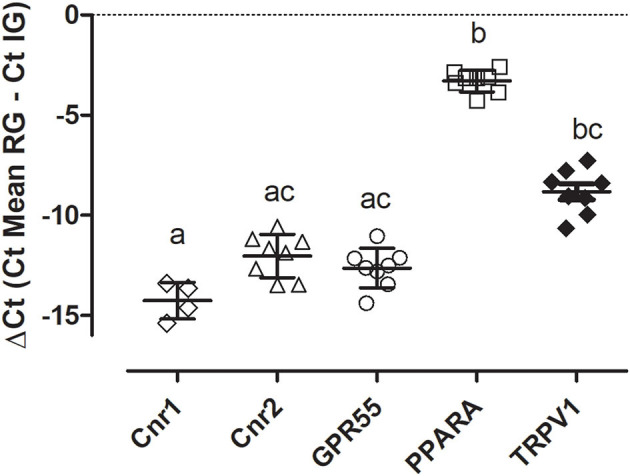
Gene expression of Cnr1, Cnr2, GPR55, PPARA, and TRPV1 in equine sinovial membranes. The results are presented as ΔCt = (Ct Mean RG – Ct IG). Symbols indicate individual animals. For each gene, mean ± SD are indicated by horizontal bars. Different letters indicate statistically significant differences (p < 0.05, Kruskal–Wallis test, Dunn's Multiple Comparison post-hoc test).