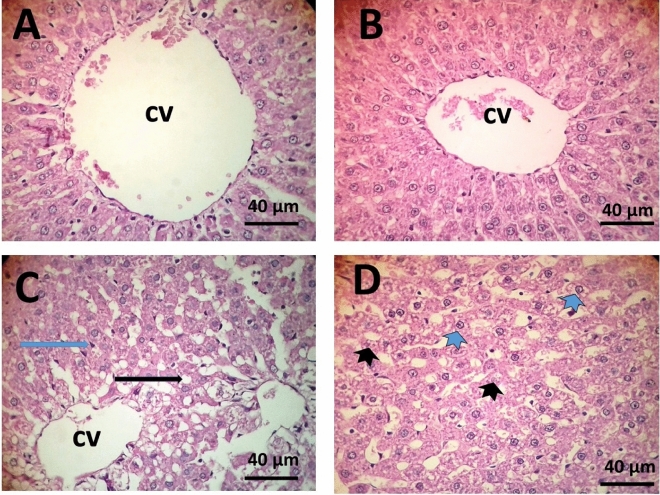
Figure 2.
Liver tissue microscopic sections showing normal appearance of hepatic cells radiating from the central vein, dilatation in the central vein (cv) in rats administered tap-water group (A); normal appearance of hepatic cells and central vein in rats administered magnetic-water group (B); droplet of lipids (black arrow) increase in Kupffer cells (blue arrow) karyolysis of nuclei (black arrowhead), vacuolation of cytoplasm (blue arrowhead) in rats administered microwave-water group (C and D). (40×) Scale bar: 40 µm.

