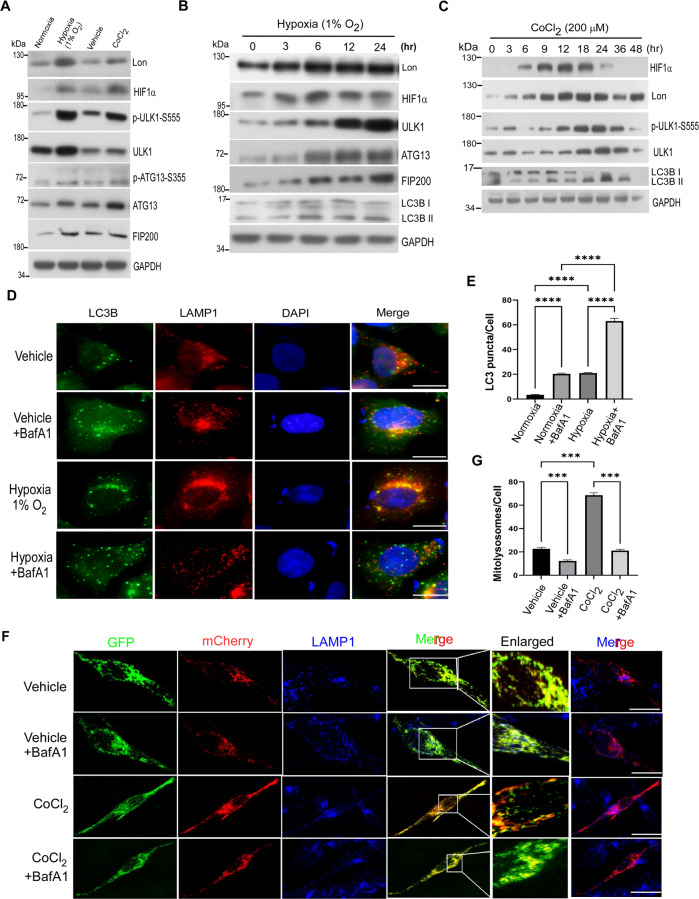
Fig. 1. Hypoxia induces ULK1-related autophagy and mitochondrial Lon in cancer cells.
A HCT-15 cells were exposed to hypoxia (1% O2) for 24 h or CoCl2 (200 µM) for 16 h and the collected lysates were immunoblotted against the mitophagy signaling using indicated antibodies. GAPDH as the loading control. B HCT-15 cells were exposed to hypoxia (1% O2) for the indicated time points and the protein levels of ULK1 signaling and LC3B were obtained after immunoblotting. Cell lysates were analyzed by immunoblotting using indicated antibodies. GAPDH as the loading control. C HCT-15 cells were treated with CoCl2 (200 μM) for different time points (0–48 h). Cell lysates were analyzed by immunoblotting using the indicated antibodies. GAPDH as the loading control. D, E Hypoxia mimic induces lysosome-mediated autophagy. D Hypoxia mimic-induced lysosome-mediated autophagy were verified by immunofluorescence. HCT-15 cells were treated with or without CoCl2 (200 μM for 18 h) and with BafilomycinA1 (100 nM for 6 h) or not. The cells were fixed and immunostained by LC3B (green) and anti-LAMP1 (red) antibodies. DNA was stained with DAPI (blue). Scale bars = 50 μm. E Hypoxia mimic-induced lysosome-mediated autophagy were quantified by LC3B puncta/cell detection according to the immunofluorescence data in D. LC3B puncta/cell was quantified by selecting more than 50 cells per condition. n = 3 biological replicates. The error bars shown in the panel represent the standard deviation from three independent experiments. ***p < 0.001. F, G Hypoxia mimic induces lysosome-mediated mitophagy. F Hypoxia mimic-induced lysosome-mediated mitophagy were verified by confocal immunofluorescence. HCT-15 cells transiently expressing mito-QC were treated with or without CoCl2 (200 μM for 18 h) and with BafilomycinA1 (100 nM for 6 h) or not. The cells were fixed and immunostained by GFP (mitochondria, green), mCherry (mitolysosome, red), and anti-LAMP1 (lysosome, blue) antibodies. Scale bars = 10 μm. G Hypoxia mimic-induced lysosome-mediated mitophagy were quantified by mcherry signals according to the immunofluorescence data in F. n = 3 biological replicates. The error bars shown in the panel represent the standard deviation from three independent experiments. ***p < 0.001.

