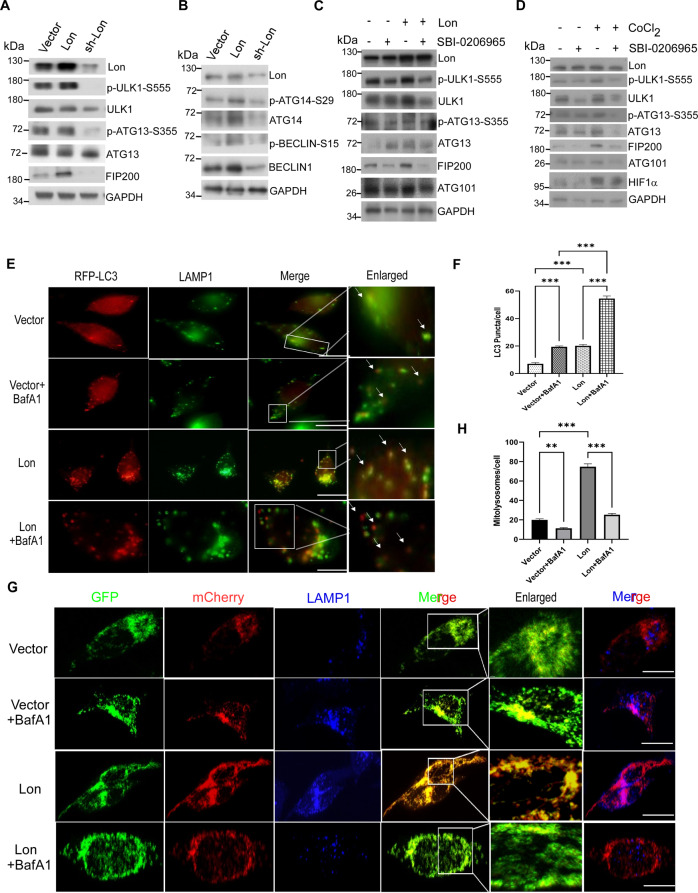
Fig. 2. Mitochondrial Lon is required for ULK1-mediated mitophagy under hypoxia.
A, B HCT-15 cells were transiently transfected with the plasmids encoding Lon or Lon-shRNA. Cell lysates were analyzed by immunoblotting using the indicated antibodies. GAPDH as the loading control. C HCT-15 cells transfected with the plasmids encoding Lon or empty were treated with SBI-0206965 (20 μM for 6 h) or not. Cell lysates were analyzed by immunoblotting using the indicated antibodies. GAPDH as the loading control. D HCT-15 cells were treated with CoCl2 (200 μM for 18 h) or not in the presence or absence of SBI-0206965 (20 μM for 6 h). Cell lysates were analyzed by immunoblotting using the indicated antibodies. GAPDH as the loading control. E, F Mitochondrial Lon induces lysosome-mediated autophagy. E Mitochondrial Lon-induced lysosome-mediated autophagy were verified by immunofluorescence. HCT-15 cells were transfected with the plasmids encoding Lon or empty and treated with BafilomycinA1 (100 nM for 6 h) or not. The cells were fixed and immunostained by RFP-LC3B (red) and anti-LAMP1 (green) antibodies. Scale bars = 50 μm. F Mitochondrial Lon-induced lysosome-mediated autophagy were quantified by LC3B puncta/cell detection according to the immunofluorescence data in E. LC3B puncta/cell was quantified by selecting more than 50 cells per condition. n = 3 biological replicates. The error bars shown in the panel represent the standard deviation from three independent experiments. ***p < 0.001. G, H Mitochondrial Lon induces lysosome-mediated mitophagy. G Mitochondrial Lon-induced lysosome-mediated mitophagy were verified by confocal immunofluorescence. HCT-15 cells transiently expressing mito-QC were transfected with the plasmids encoding Lon or empty and treated with BafilomycinA1 (100 nM for 6 h) or not. The cells were fixed and immunostained by GFP (mitochondria, green), mCherry (mitolysosome, red), and anti-LAMP1 (lysosome, blue) antibodies. Scale bars = 10 μm. H Mitochondrial Lon-induced lysosome-mediated mitophagy were quantified by mcherry signals according to the immunofluorescence data in F. n = 3 biological replicates. The error bars shown in the panel represent the standard deviation from three independent experiments. ***p < 0.001.

