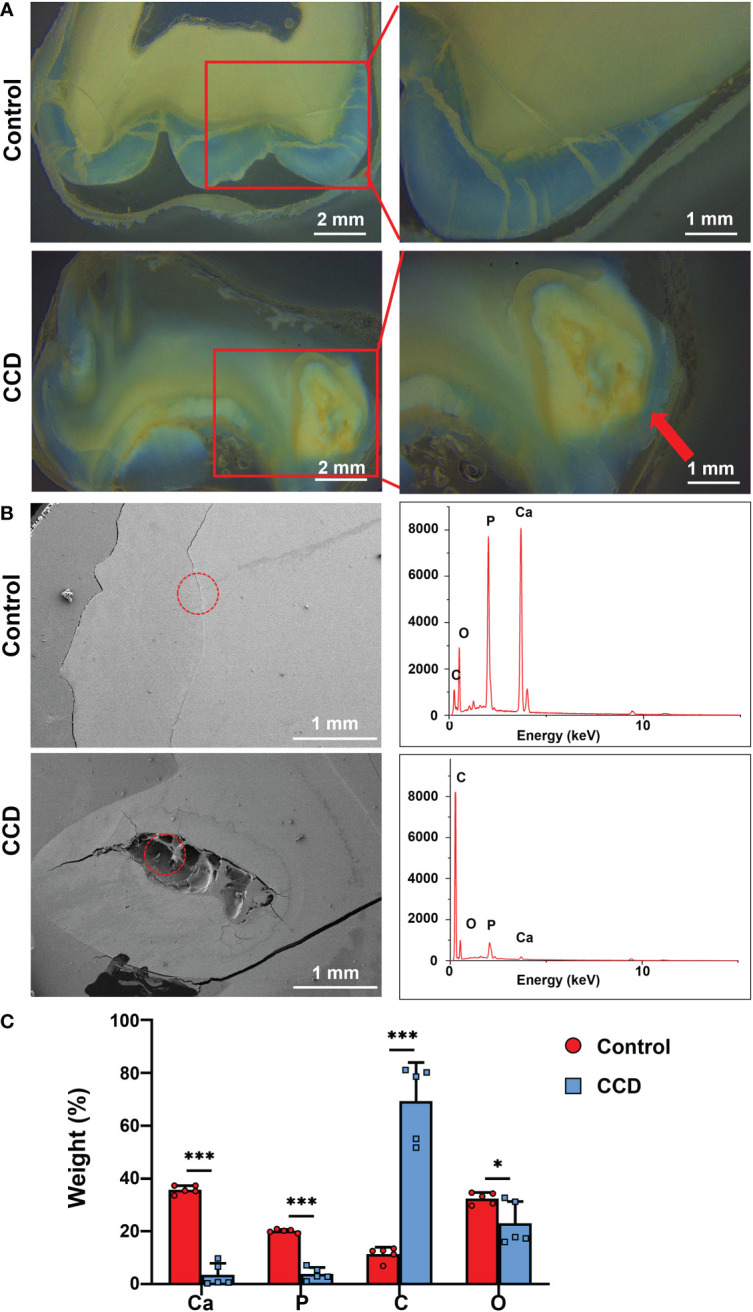
Figure 4.

Dentinogenesis imperfecta of patients with CCD. (A) Stereo microscopy showing the morphology difference between the two groups. Red arrow indicates the disorganized structure of dentin. Scale bar: 2 mm, 1 mm. (B) SEM images and EDX spectra of the two groups. The red circle refers to the analyzed area of the EDX spectra. Scale bar, 1 mm. (C) Weight percentage of the elements of tooth slabs of the two groups (n = 5, *p < 0.05, ***p < 0.001).
