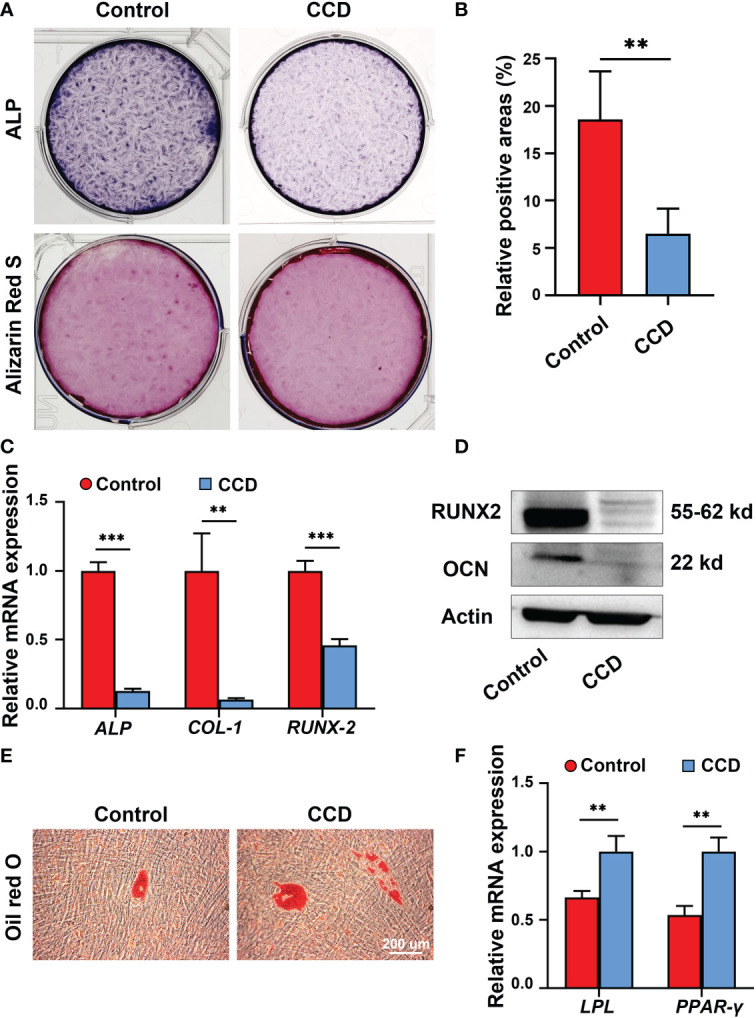
Figure 6.

The impaired osteogenic potential of SHED from patients with CCD. (A) ALP and Alizarin Red S staining of SHED after osteogenic induction. (B) Alizarin Red S staining showing mineralized nodules obviously decreased in CCD group compared with the control group (n = 5, **p < 0.01). (C) qRT-PCR analysis of the expression of ALP, COL-1, and RUNX2 after 14 d of osteogenic induction (n = 5, **p < 0.01, ***p < 0.001). (D) Western blot analysis showing OCN and RUNX2 protein expression levels in the two groups. Scale bar: 200 μm. (E) Oil red O staining of SHED after 7 d of adipogeneic induction. (F) qRT-PCR analysis of the expression of LPL and PPAR-γ of SHED (n = 5, **p < 0.01).
