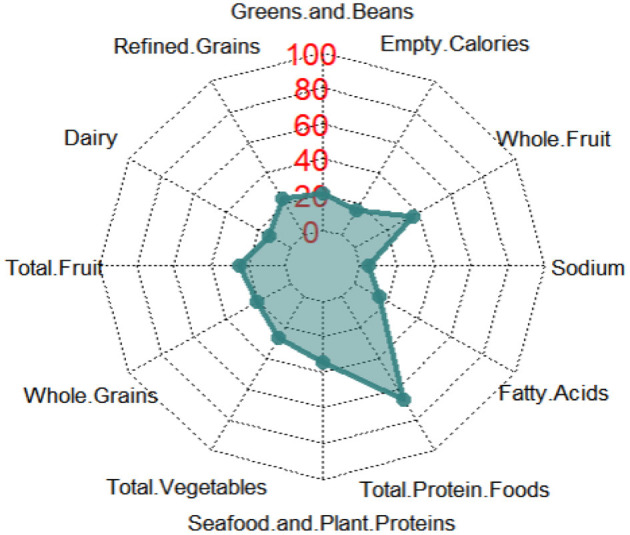
Figure 2.

Radar graph depicting the weighted proportions of participants who obtained the highest component score for each component of HEI-2010. The radar graph shows all 12 components of HEI-2010, including total vegetables, greens and beans, total fruits, whole fruits, total dairy, total protein foods, seafood and plant proteins, whole grains and fatty acid ratio, sodium, refined grains, and empty calories.
