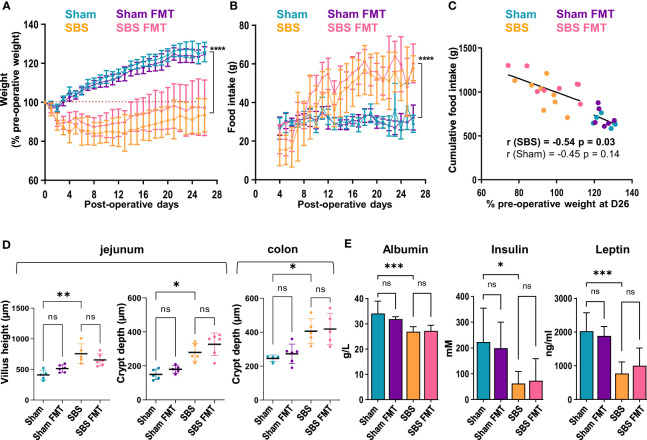
Figure 1.
Weight follow-up and biological measurements in the 4 groups. (A) Weight expressed as percentage of the pre-operative weight of the Sham (blue, n=6), Sham-FMT (purple, n=6), SBS (orange, n=8) and SBS-FMT (pink, n=8) rats, during 26 days after surgery. (B) Food intake (in grams) of Sham (blue, n=6), Sham-FMT (purple, n=6), SBS (orange, n=8) and SBS-FMT (pink, n=8) rats, during 26 days after surgery. (C) Correlation diagrams between cumulative food intake and weight expressed as percentage of the pre-operative weight for all Sham rats (blue and purple, n=12) (Pearson test, r= - 0.45, ns: p> 0.05) and for all SBS rats (orange and pink n=16) (Pearson test, r= - 0.54, p < 0.0001) at day 26. (D) Comparaison of jejunal villus height and crypt depth, and colonic crypt depth in Sham (blue, n= 4 or 5), Sham-FMT (purple, n= 5 or 6), SBS (orange, n= 5) and SBS-FMT (pink, n= 5 or 6). (E) Albumin, insulin and leptin concentrations in Sham and SBS rats with or without fecal microbiota transplant, with n=6 for Sham, n=6 for Sham-FMT, n=8 for SBS and n=8 for SBS-FMT. Data are shown as mean ± SD, the asterisks indicate a significant difference between groups (Kruskal-Wallis test followed by Dunn’s post hoc test, *p<0.05, **p<0.01, ***p<0.001, ****p<0.0001, ns, p>0.05).

