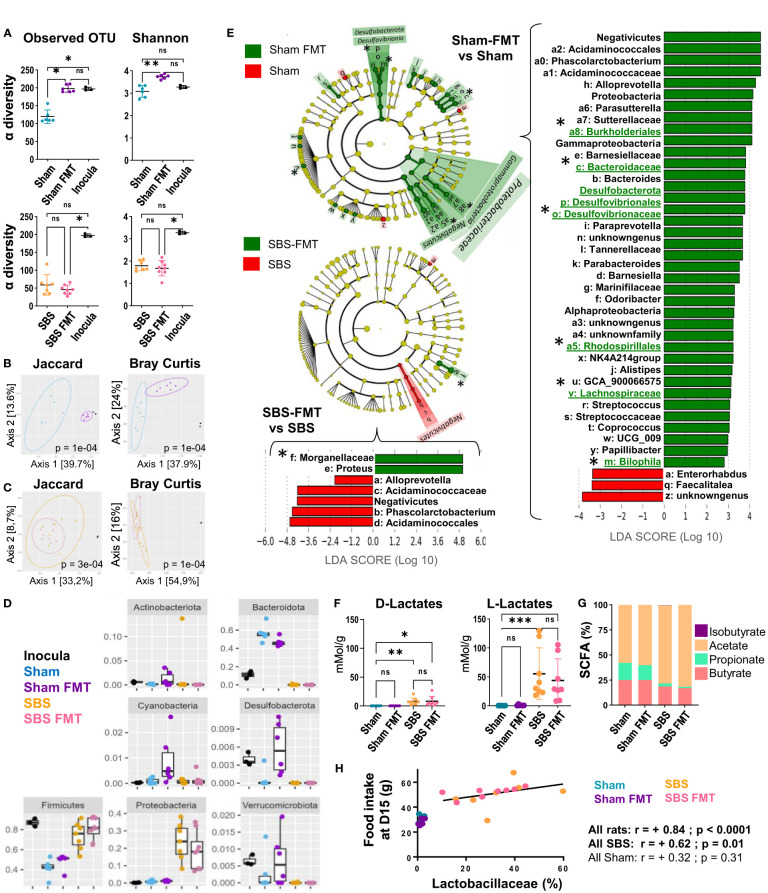
Figure 4.
Analysis of the fecal microbiota bacterial composition and derived-metabolites, in the Sham and SBS rats with or without FMT. (A) Alpha diversity of observed species estimated by observed OTUs counts and Shannon indices in the microbiota of Sham (blue, n=6) and Sham-FMT (purple, n=6) or SBS (orange, n=7) and SBS-FMT (pink, n=8) rats and inocula (black, n=3); Data are represented as mean ± SD and significant differences between groups were determined using Kruskal-Wallis test and Dunn’s post hoc tests *p<0.05, **p<0.01, ns: p>0.05). (B, C) Principal coordinates analysis (PCoA) of bacterial β-diversity within Sham rats (blue, n=6), Sham-FMT rats (purple, n=6) and inocula (black, n=3) (B) and SBS rats (orange, n=7), SBS-FMT rats (pink, n=8) and inocula (black n=3) (C) using Jaccard and Bray-Curtis distance plots; P-value were determined using PERMANOVA test (Permutational Multivariate Analysis of Variance Using Distance Matrices). (D) Distribution and abundance of the 7 most abundant bacterial phyla among the 4 groups of rats (Sham (blue), Sham-FMT (purple), SBS (orange), SBS-FMT (pink) and in the inocula (black) determined by the relative proportion of 16S rRNA reads. Data are represented as mean ± SD and a Kruskal-Wallis test was used to compare groups. (E) Linear discriminant analysis (LDA) integrated with effect size (LEfSe). Cladogram of differentially abundant taxa in Sham-FMT (n=6) vs. Sham (n=6) and SBS-FMT (n=8) vs. SBS (n=7). The LDA score indicates the effect size and ranking of each differentially abundant taxon; p<0.01 for LDA score >2.0. Bacterial groups of interest are underlined and highlighted with asterisks in the figure (F) Lactate concentrations in the feces of Sham (blue, n=6), Sham-FMT (purple, n=6), SBS (orange, n=8), and SBS-FMT (pink, n=8) rats; (Kruskal-Wallis test followed by Dunn’s post hoc test, *p<0.05, **p<0.01, ***p<0.001, ns, p>0.05). (G) Proportions of the main SCFA (butyrate, propionate, acetate and isobutyrate) in the feces of Sham (n=6), Sham-FMT (n=6), SBS (n=8), and SBS-FMT (n=8) rats. (H) Correlation diagrams between food intake and the proportion of Lactobacillaceae in the fecal microbiota at day 15 for all Sham rats (blue and purple) (Spearman r =+0.32, p =0.310, n=12) or all SBS rats (orange and pink) (Spearman r= +0.70 p<0.01, n=15).

