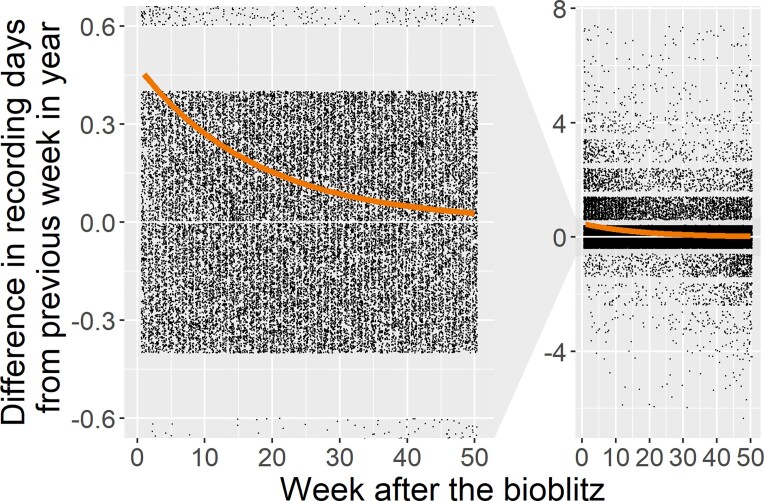
Figure 4.
Bioblitzes trigger increased participant activity with biological recording that lasts for several weeks after the bioblitz. The difference of recording activity in days per week for 3378 recorders from 100 bioblitzes 1 year before and 1 year after the bioblitz they participated in. The y-axis shows the difference in the number of recording days per week compared with the same week in the year preceding the bioblitzes (enlarged on left). Values range between −7 (i.e., if a person recorded 7 days less in the year after the bioblitz) and 7 (i.e., if a person recorded 7 days more in the year after the bioblitz) however points are jittered to make them visible. The line is fitted with a nonlinear exponential model. Pre- and postbioblitz activity were compared each week to remove any seasonal effects of recording activity and we compared recording activity expressed as the weekly devoted days rather than number of observations to help remove differences related to species abundances.

