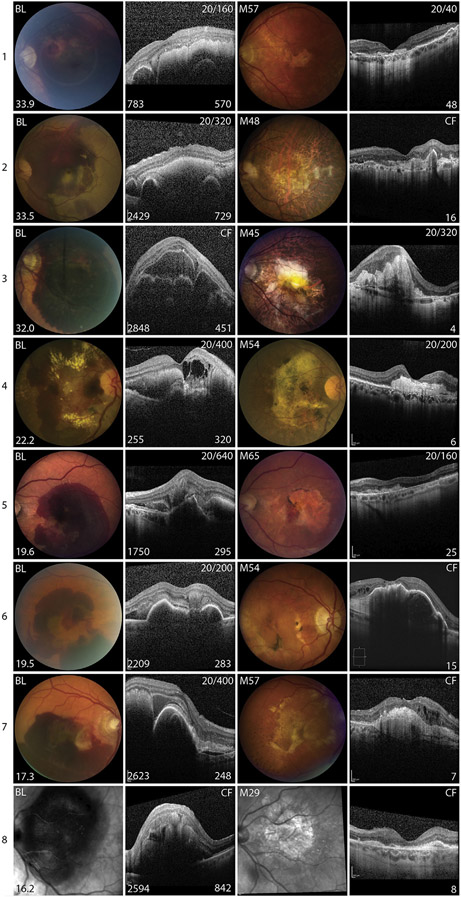
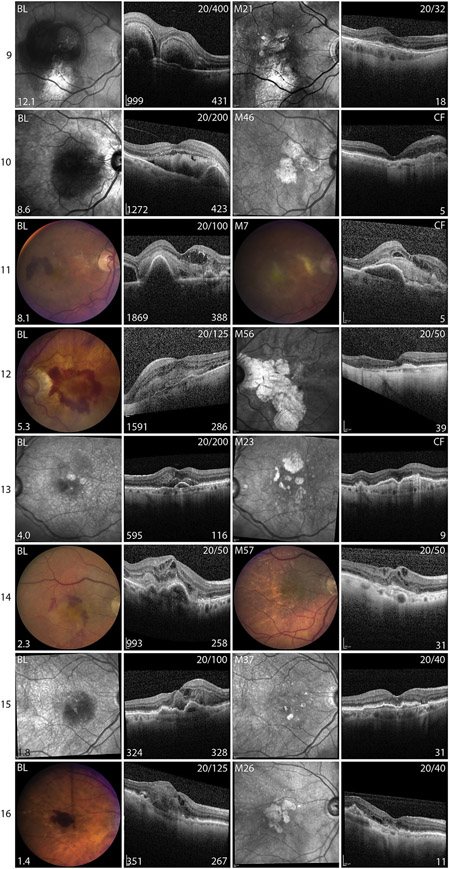
FIGURE 3.
Images from baseline and last follow-up visit for patients with subfoveal hemorrhages owing to neovascular age-related macular degeneration. Color fundus photographs (CFP) or infrared (IR) images and horizontal spectral-domain optical coherence tomography (SD-OCT) scans through fovea in patients with subfoveal hemorrhage (SFH) organized in descending order of area of hemorrhage from 1 to 16. First column shows CFP or IR image at baseline (BL) visit and the area of SFH in disc areas is in the lower left corner. The second column shows the horizontal SD-OCT scan through the fovea at BL. Snellen visual acuity (VA) at BL is shown in the upper right corner, thickness of the SFH (μm) is shown in the lower right corner, and the distance from the fovea to the edge of the hemorrhage (μm) is shown in the lower left corner. The third column shows CFP or IR image at last follow-up visit, with time in months (M) after baseline in the upper left corner. The fourth column shows horizontal SD-OCT scan through the fovea at last follow-up visit, with VA shown in the upper right corner and number of anti-VEGF injections shown in the lower right corner.


