
Figure 1.
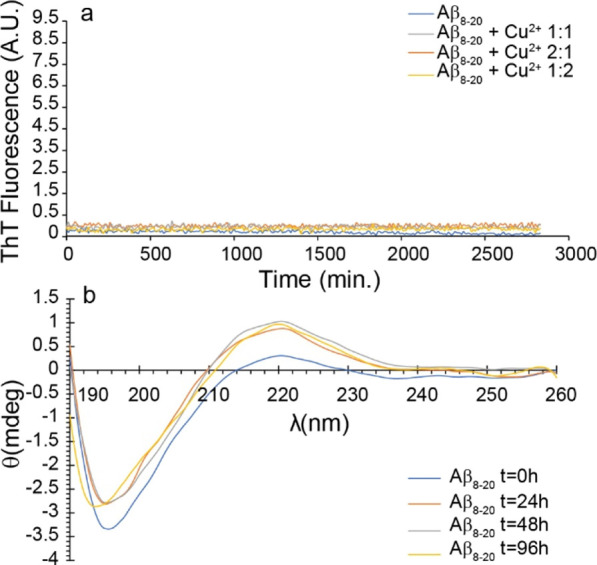
(a) Amyloid aggregation measured by the ThT assay of 10 μM Aβ8-20 (blue curve), Aβ8-20:Cu2+ 1:1 (gray curve), Aβ8-20:Cu2+ 2:1 (orange curve), and Aβ8-20:Cu2+ 1:2 (yellow curve). (b) Secondary structure measured by CD of 10 μM Aβ8-20 at t = 0 (blue curve), t = 24 h (orange curve), t = 48 h (gray curve), and t = 96 h (yellow curve). All the experiments were performed in 10 mM MOPS buffer and 100 mM NaCl, pH 7.4. ThT curves are the average of three independent experiments.