
Figure 4.
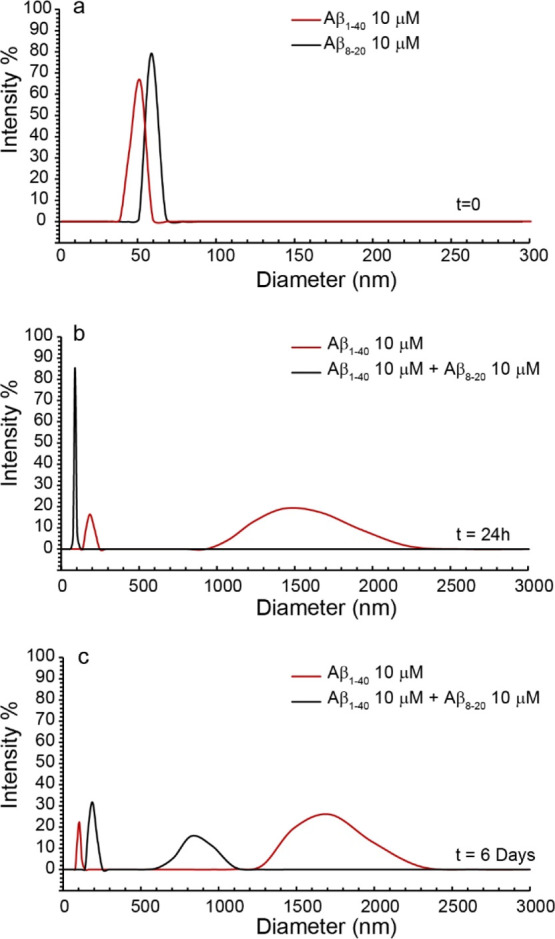
Intensity-weighted hydrodynamic diameter distribution for (a) 10 μM Aβ1-40 and Aβ8-20 at t = 0 and (b) 10 μM Aβ1-40 (red line) and Aβ1-40:Aβ8-20 1:1 concentration ratio (black line) at t = 24 h and (c) at t = 6 days. Curves are the average of three independent experiments. Measures were performed at 37 °C in 10 mM phosphate buffer.