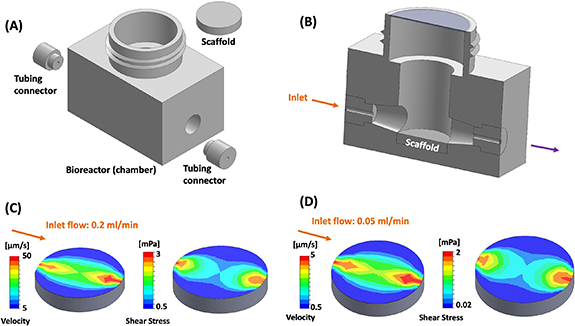
Figure 2.

(A) Bioreactor assembly components (B) sectional view of bioreactor assembly (C) velocity and shear stress distribution on scaffold surface at inlet flow of 0.2 ml min−1 (D) velocity and shear stress distribution on scaffold surface at inlet flow of 0.05 ml min−1. Arrows represent the direction of fluid flow.
