
Figure 8a.
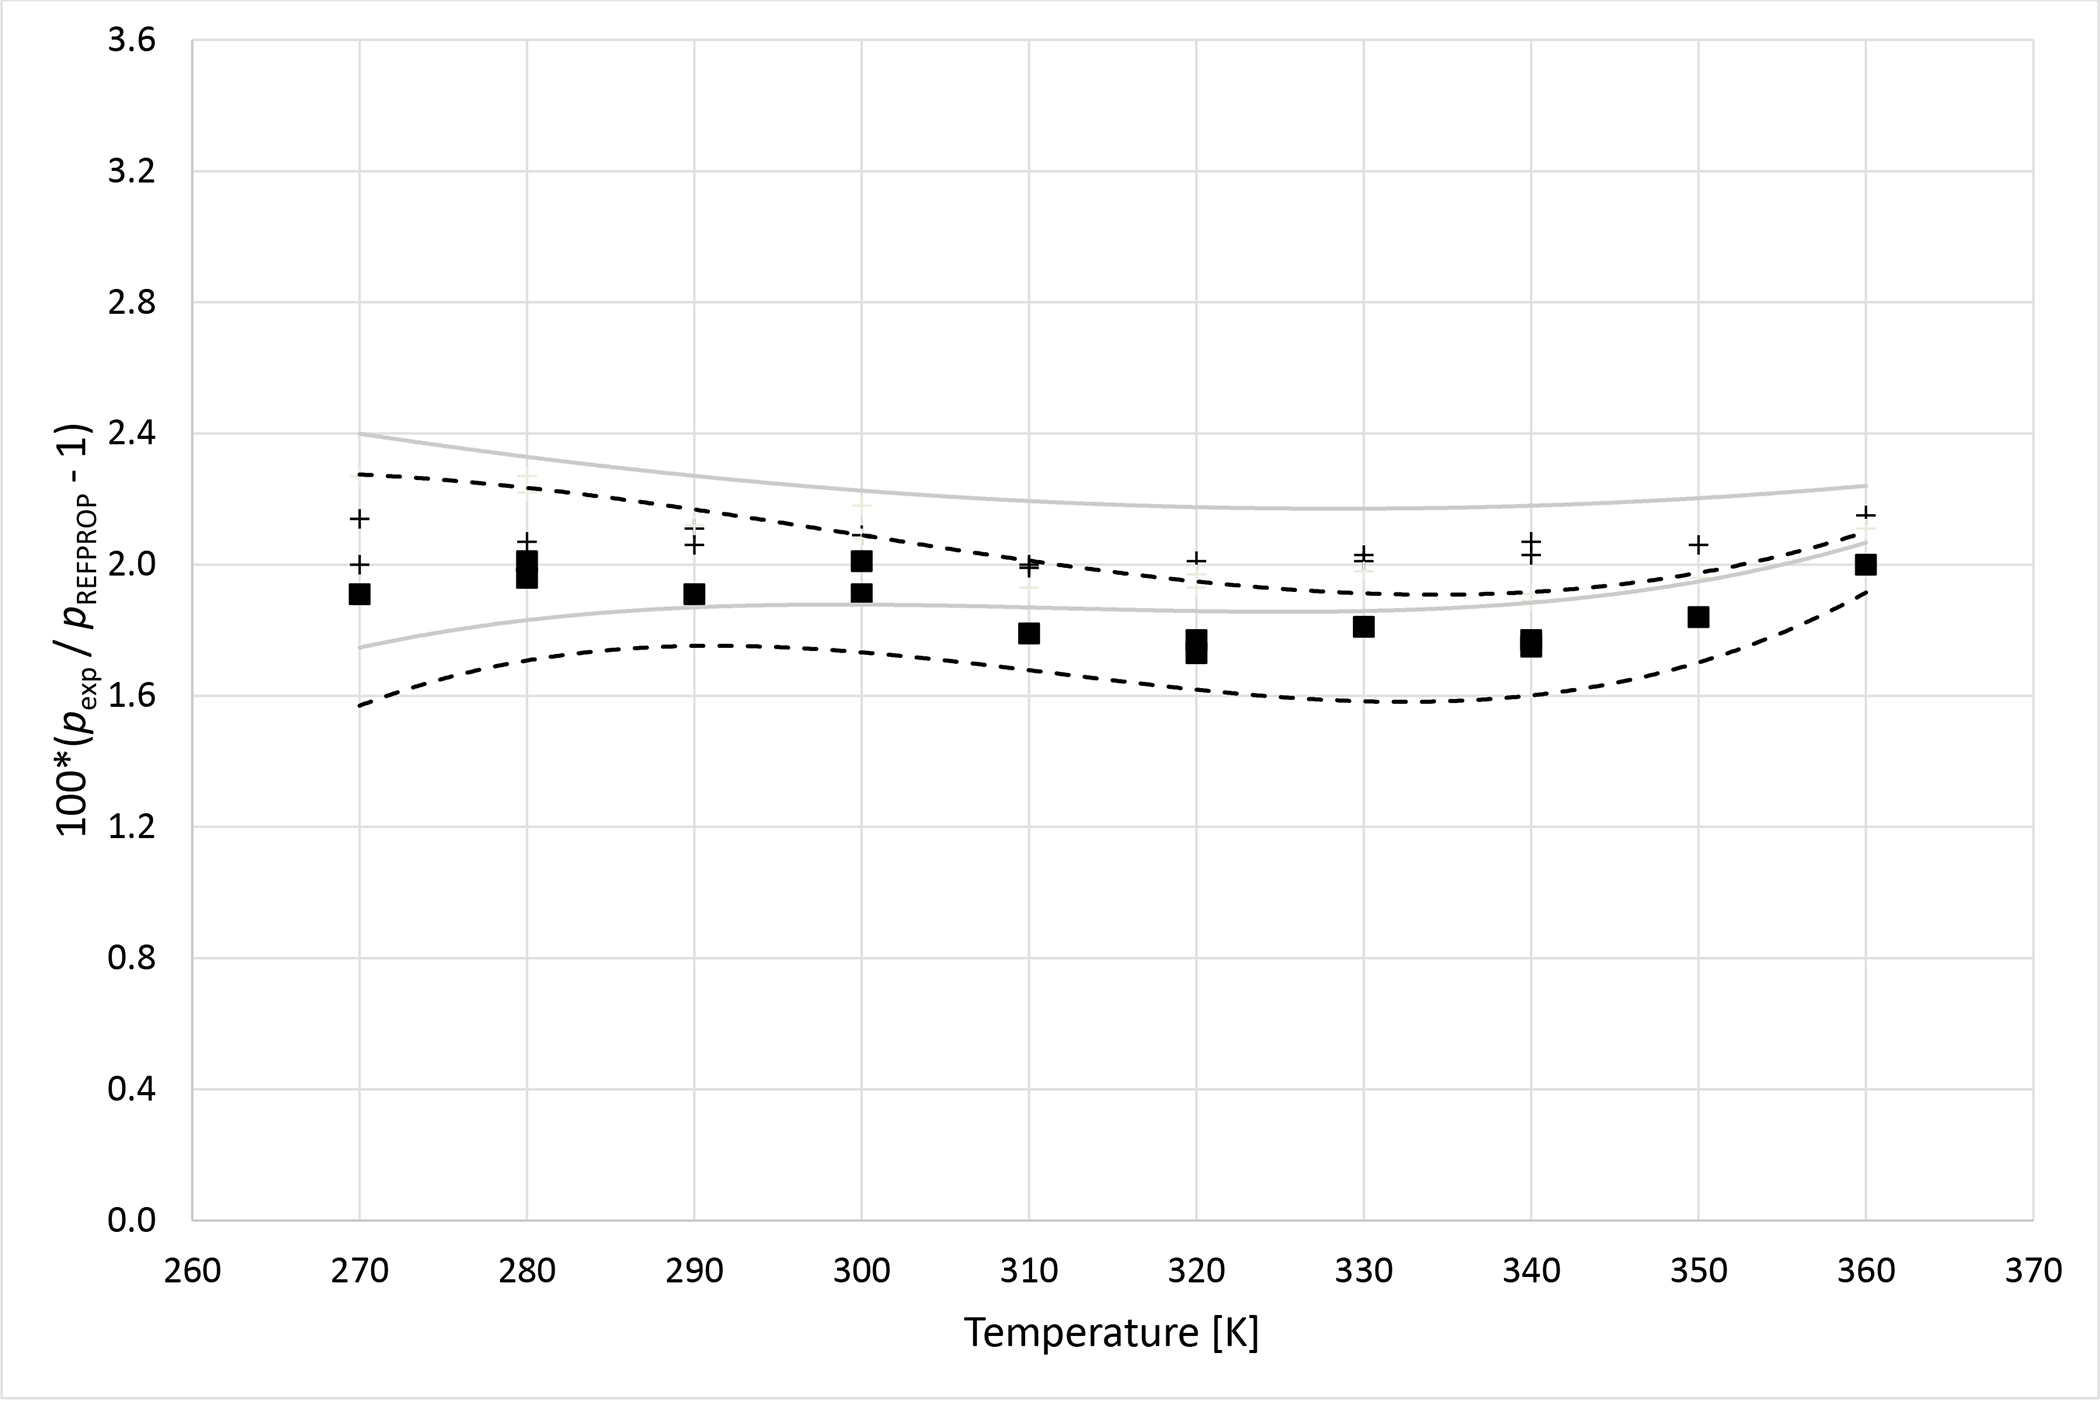
Deviations from pressures calculated with REFPROP5 for the mixture R1234ze (E) (1) + R227ea (2) as a function of temperature for data measured in this work ■ (x1 = 0.3347), + (x1 = 0.6800). Dashed curves (- - -) represent approximate experimental uncertainty bounds for x1 = 0.3347 and solid curves for x1 = 0.6800.