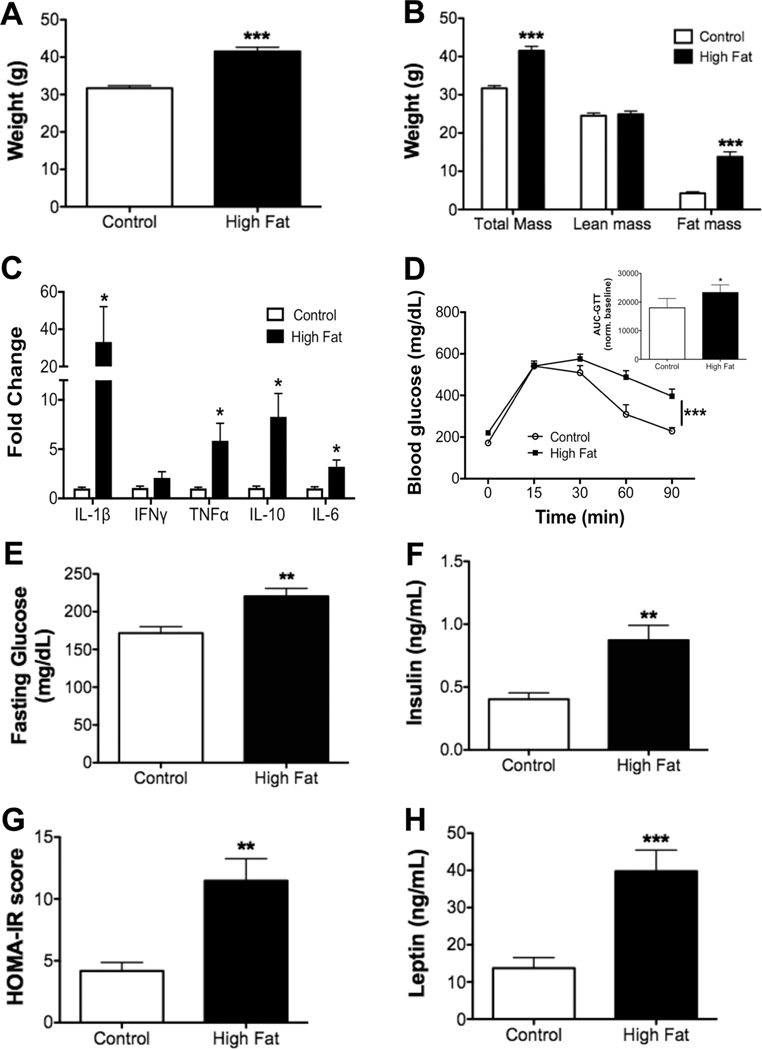
FIGURE 1. Metabolic profile of male C57BL/6J mice consuming a high fat diet.
(A) Body weights of male mice at the completion of the study. (B) Body composition assayed by Echo-MRI after 15 weeks of consuming experimental diets. (C) qRT-PCR analysis of inflammatory cytokines in the adipose tissue of control and obese mice. (D) Glucose tolerance test (GTT), performed by intraperitoneal injection of glucose after a 6 h fast. Inset shows the area under the curve (AUC), calculated by integration of the glucose curves shown in subpart (D), normalized to baseline values. (E) Fasting blood glucose and (F) insulin levels determined after a 6 h fast. (G) HOMA-IR scores. (H) Fasting leptin levels. N = 9–10 mice per diet (A, B, and D), N = 8 mice per diet (C), N = 6–8 mice per diet (E–H). Data are average ± S.E.M. *P < 0.05, **P < 0.01, ***P < 0.001 by a Student’s unpaired t-test (A–C, E–H) or a two-way ANOVA analysis followed by a post hoc t-test (D)

