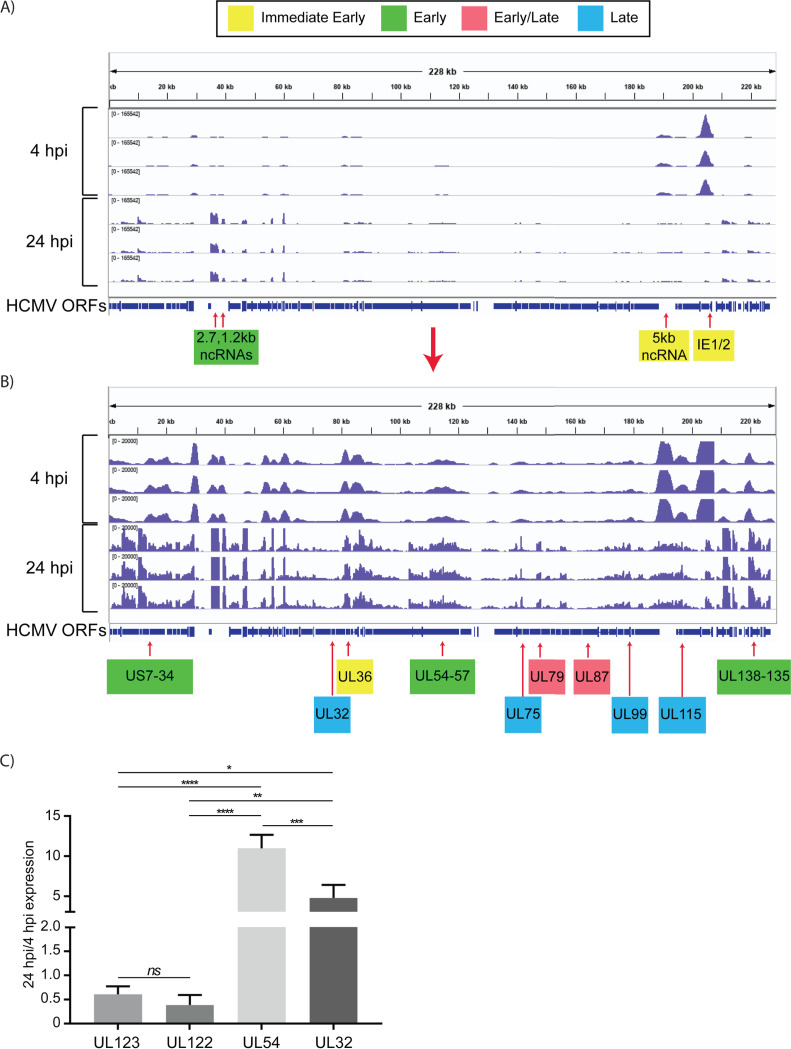
FIG 2.
Expression of HCMV RNAs in infected Kasumi-3 cells at 4 and 24 hpi. (A) IGV (Integrative Genomics Viewer) of RNA-seq coverage of the entire HCMV genome at 4 and 24 hpi in infected Kasumi-3 cells. (B) Reduced-scale view of the RNA-seq coverage map to allow the visualization of all the expressed viral transcripts. Selected immediate early, early, early/late, and late genes are shown in yellow, green, pink, and blue, respectively. Kinetic classes are based on previous analyses of HCMV-infected fibroblasts (57, 61–64, 66, 67, 137–139). Three independent experiments are shown for each time. HCMV sequences were aligned to TB40/E clone TB40-BAC4 (EF999921.1), to which the GFP gene sequence was added. (C) RT-qPCR validation of changes in the relative abundance of selected viral genes between 4 and 24 hpi. Statistical significance was determined by one-way analysis of variance (ANOVA) with Tukey’s multiple-comparison test. *, P < 0.05; **, P < 0.01; ***, P < 0.001; ****, P < 0.0001.

