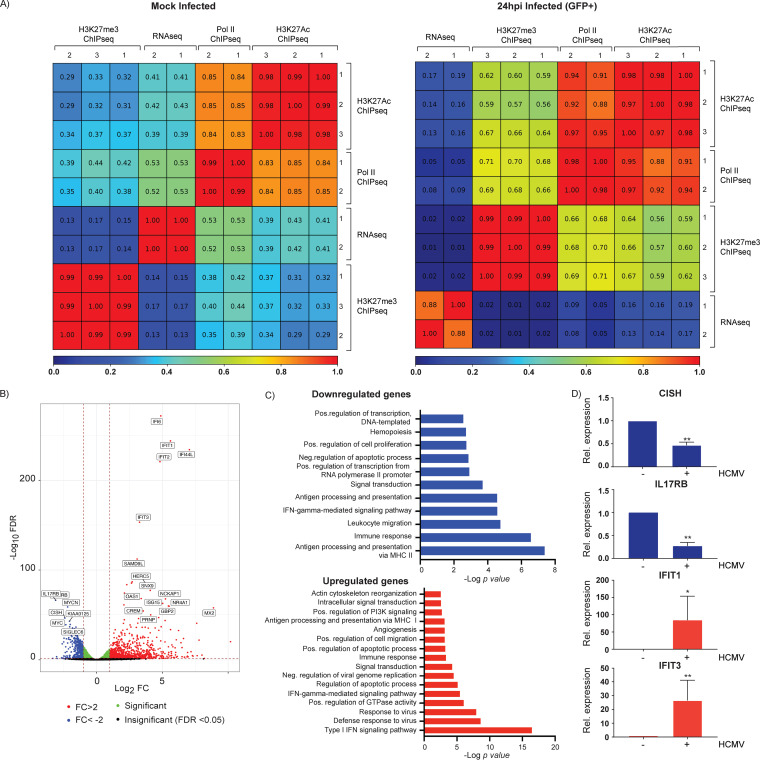
FIG 8.
Changes in cellular gene expression induced by HCMV infection at 24 hpi. (A) Pearson correlation analyses between replicates of RNA-seq, Pol II ChIP-seq, H3K27Ac ChIP-seq, and H3K27me3 ChIP-seq from mock-infected and TB40/Ewt-GFP-infected sorted cells at 24 hpi. (B) Volcano plot showing differential gene expression between mock-infected and GFP+-infected Kasumi-3 cells at 1 dpi. Vertical lines indicate a log2 fold change (FC) of 1 and −1. (C) DAVID functional GO analysis of biological processes (BP) enrichment for downregulated and upregulated genes in HCMV-infected cells compared to mock-infected cells (adjusted P value < 0.05, −1 < log2 FC > 1). (D) RT-qPCR validation of changes in cellular gene expression induced by HCMV infection. RNAs from HCMV-infected (+) or mock-infected Kasumi-3 cells (−) were analyzed for the indicated cellular genes. Statistical significance was determined by one-way ANOVA with Tukey’s multiple-comparison test. *, P < 0.05; **, P < 0.01.

