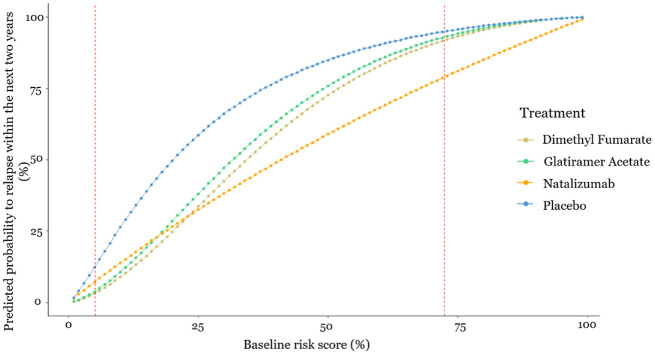
Figure 2.
Estimated probability to relapse within the next 2 y as a function of the baseline risk score. The x-axis shows the baseline risk score of relapsing within the next 2 y, and the y-axis shows the estimated probability of relapsing within the next 2 y under each of the treatments. Between the 2 dashed vertical lines are the baseline risk values observed in the data used.

