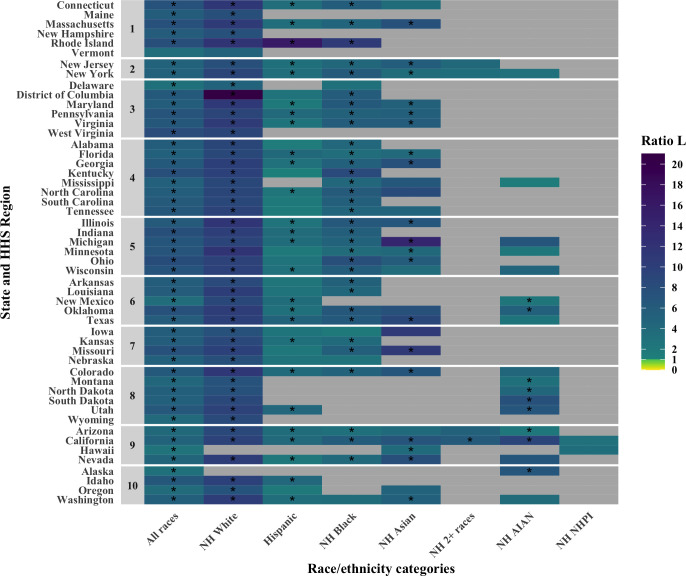
Fig 1. Comparative performance of policies S and F (shown in the form of a ratio L = ) for all race/ethnicity categories in all states and the District of Columbia in terms of lives saved.
States are grouped by HHS Region. Stars indicate the race/ethnicity/state for which the lower bound of the 95% interval did not include 1.

