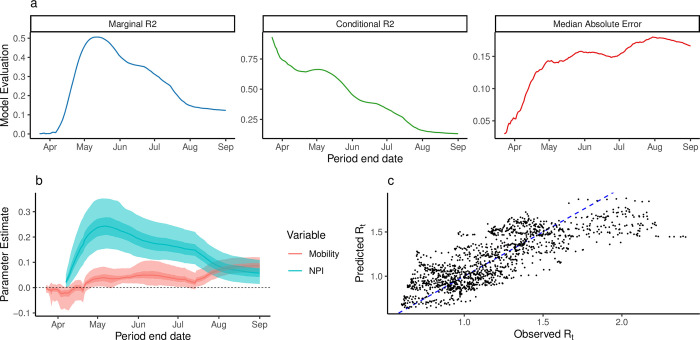
Fig 4. Statistical analysis of Rt.
a) The marginal R2, Conditional R2, and median absolute error of the multilevel model trained on varying-length periods through time. b) Parameter estimates of association of Rt with NPI and Mobility. Estimates shown with 50% and 95% bootstrap confidence intervals. c) Observed vs Predicted Rt for the model trained between 12th March and 12th May, 2020. Diagonal where x = y shown as blue dashed line.

