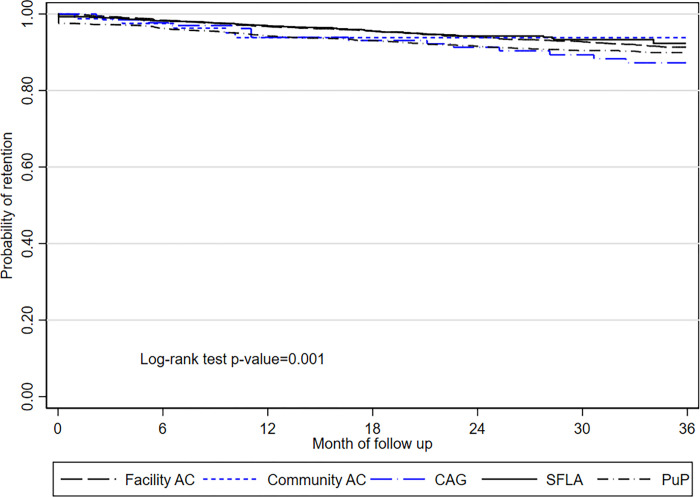
Fig 3. Kaplan Meier survival curves for probability of retention on ART among patients in DMOC, 2012–2018, KwaZulu Natal, South Africa.
The long dash black line = facility AC, facility adherence club; the short dash blue line = community AC, community adherence club; the long dash-dot blue line = CAG, community ART group; the solid black line = SFLA, spaced and fast lane appointment model; the dash-dot black line, PuP = decentralized medication delivery at community pick up points.

