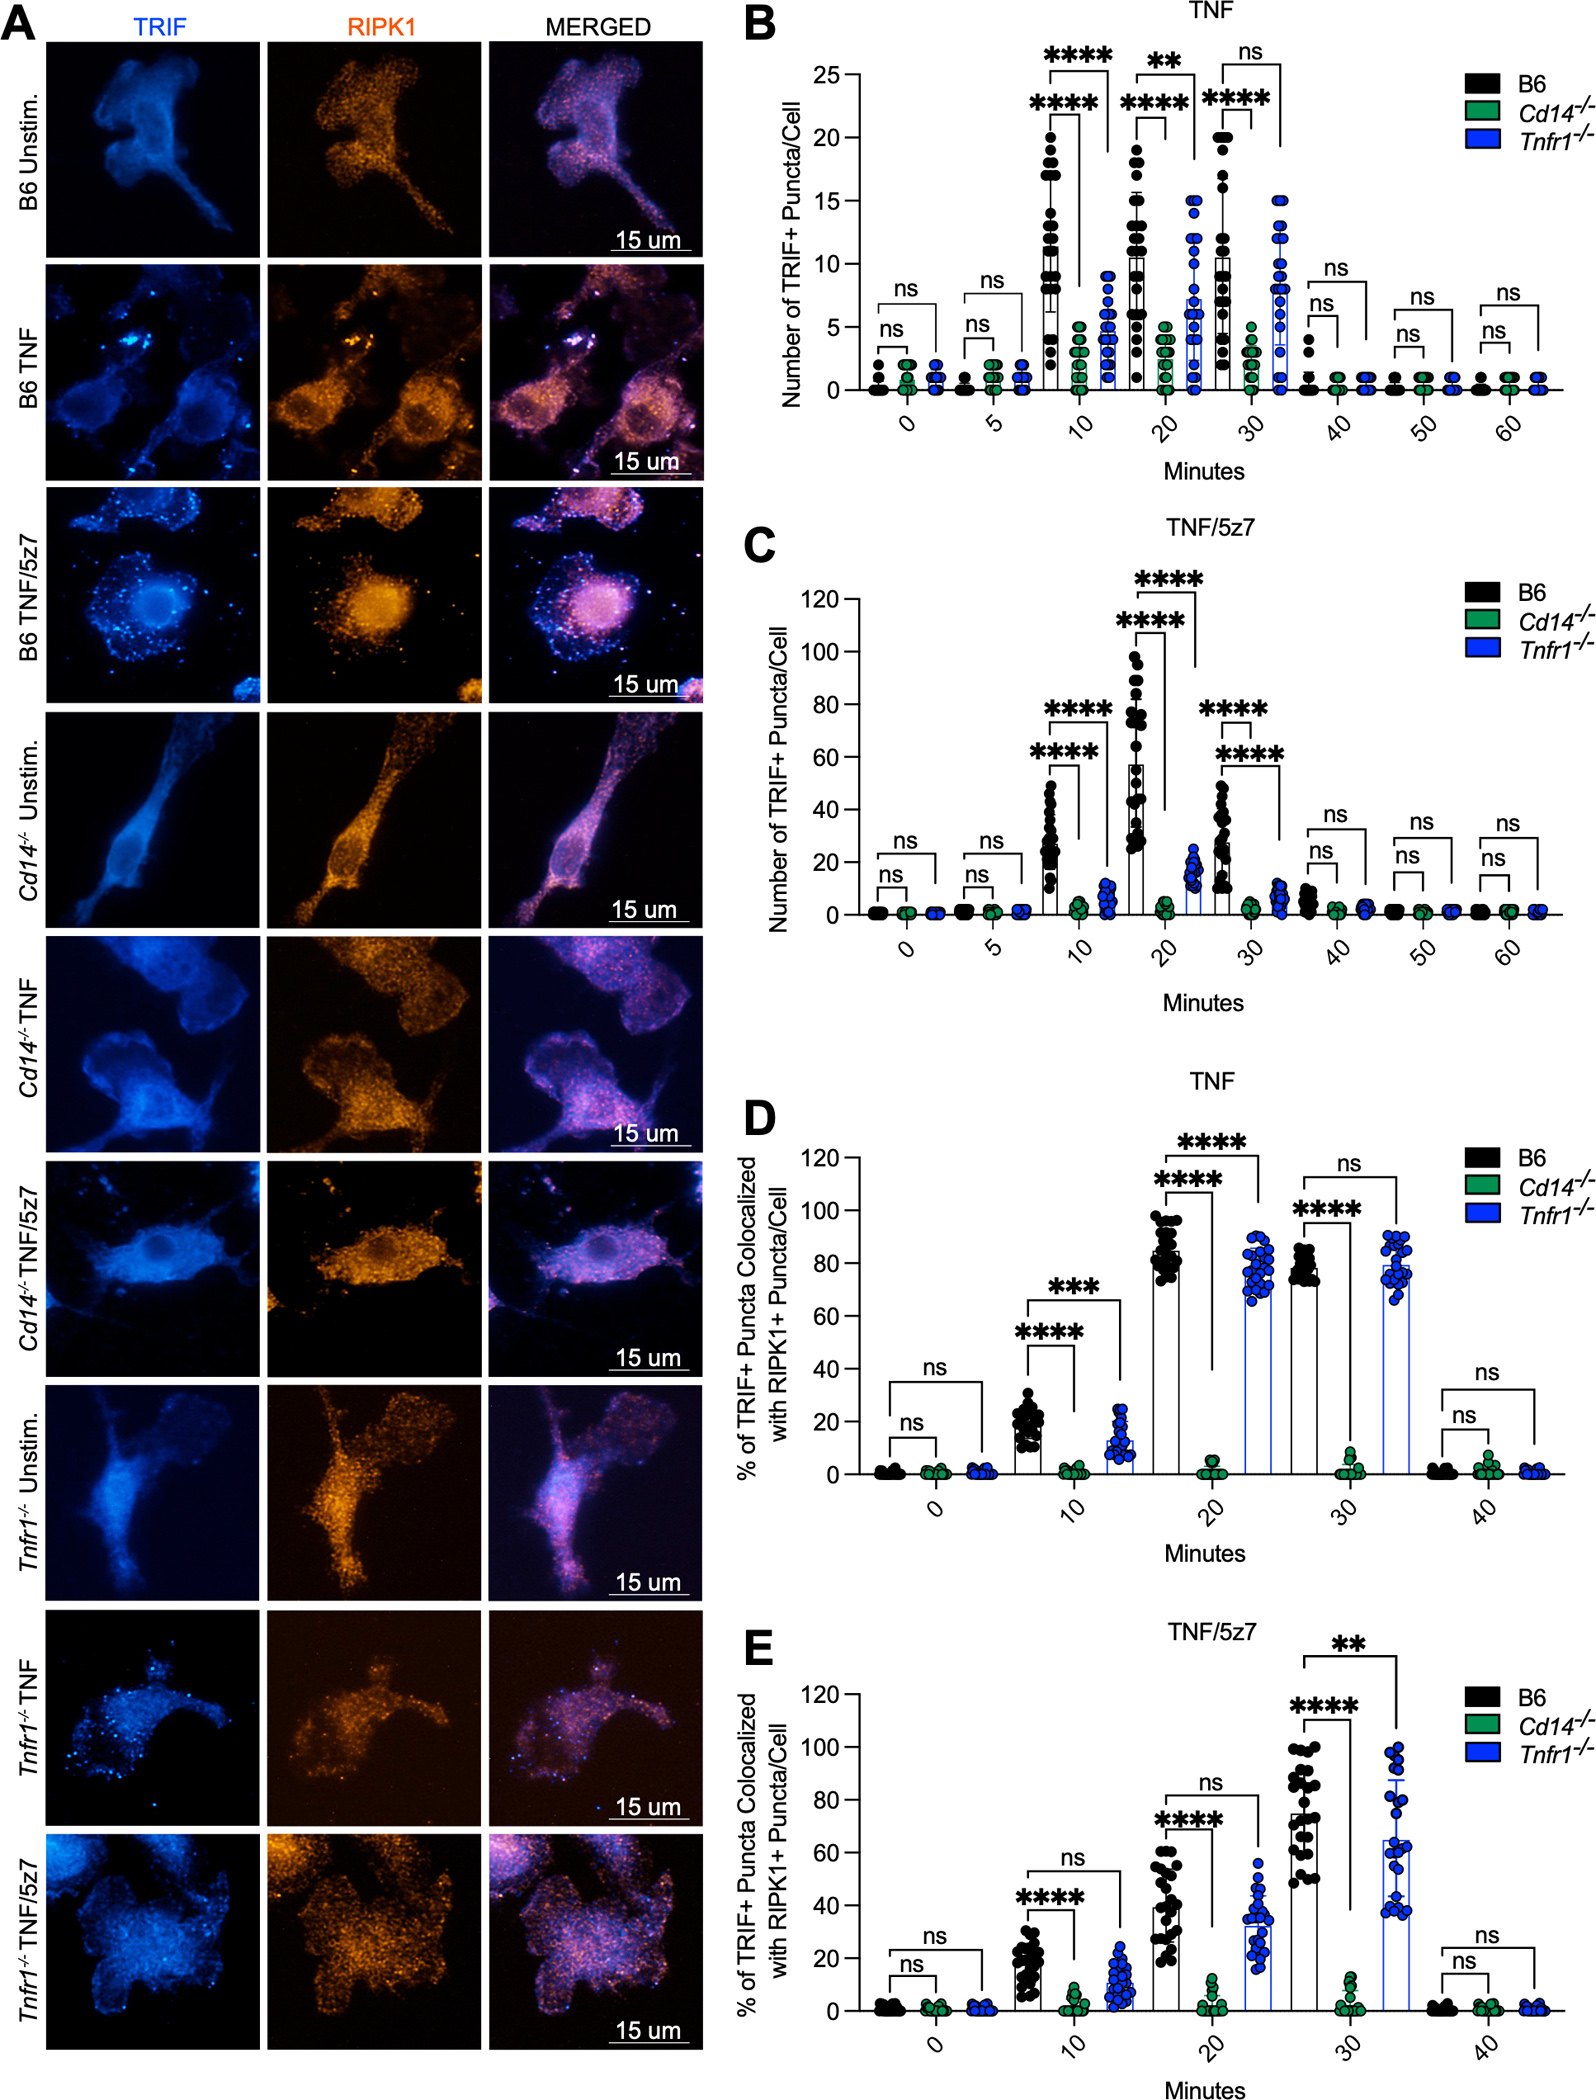
Fig. 2. CD14-mediated internalization of TNF-R1 promotes TRIF-RIPK1 colocalization in macrophages.

(A) Representative 60X images of TRIF or RIPK1 staining and colocalization in B6, Cd14−/− and Tnfr1−/−macrophages stimulated with mTNF or mTNF/5z7 for 20 minutes. (B, C) Quantification of the number of TRIF+ puncta/cell over time in response to (B) mTNF or (C) mTNF/5z7 in B6, Cd14−/− and Tnfr1−/−macrophages. (D, E) Quantification of the percentage of TRIF+ puncta colocalized with RIPK1+ puncta/cell over time in response to (D) mTNF or (E) mTNF/5z7 in B6, Cd14−/− and Tnfr1−/−macrophages. Data from imaging experiments are representative of three or more independent experiments, data points indicate individual cells, n=25. Analysis of variance (ANOVA) was used for comparison between groups: ns, nonsignificant (p>0.05); *p<0.05; **p<0.01; ***p<0.001; ****p<0.0001.
