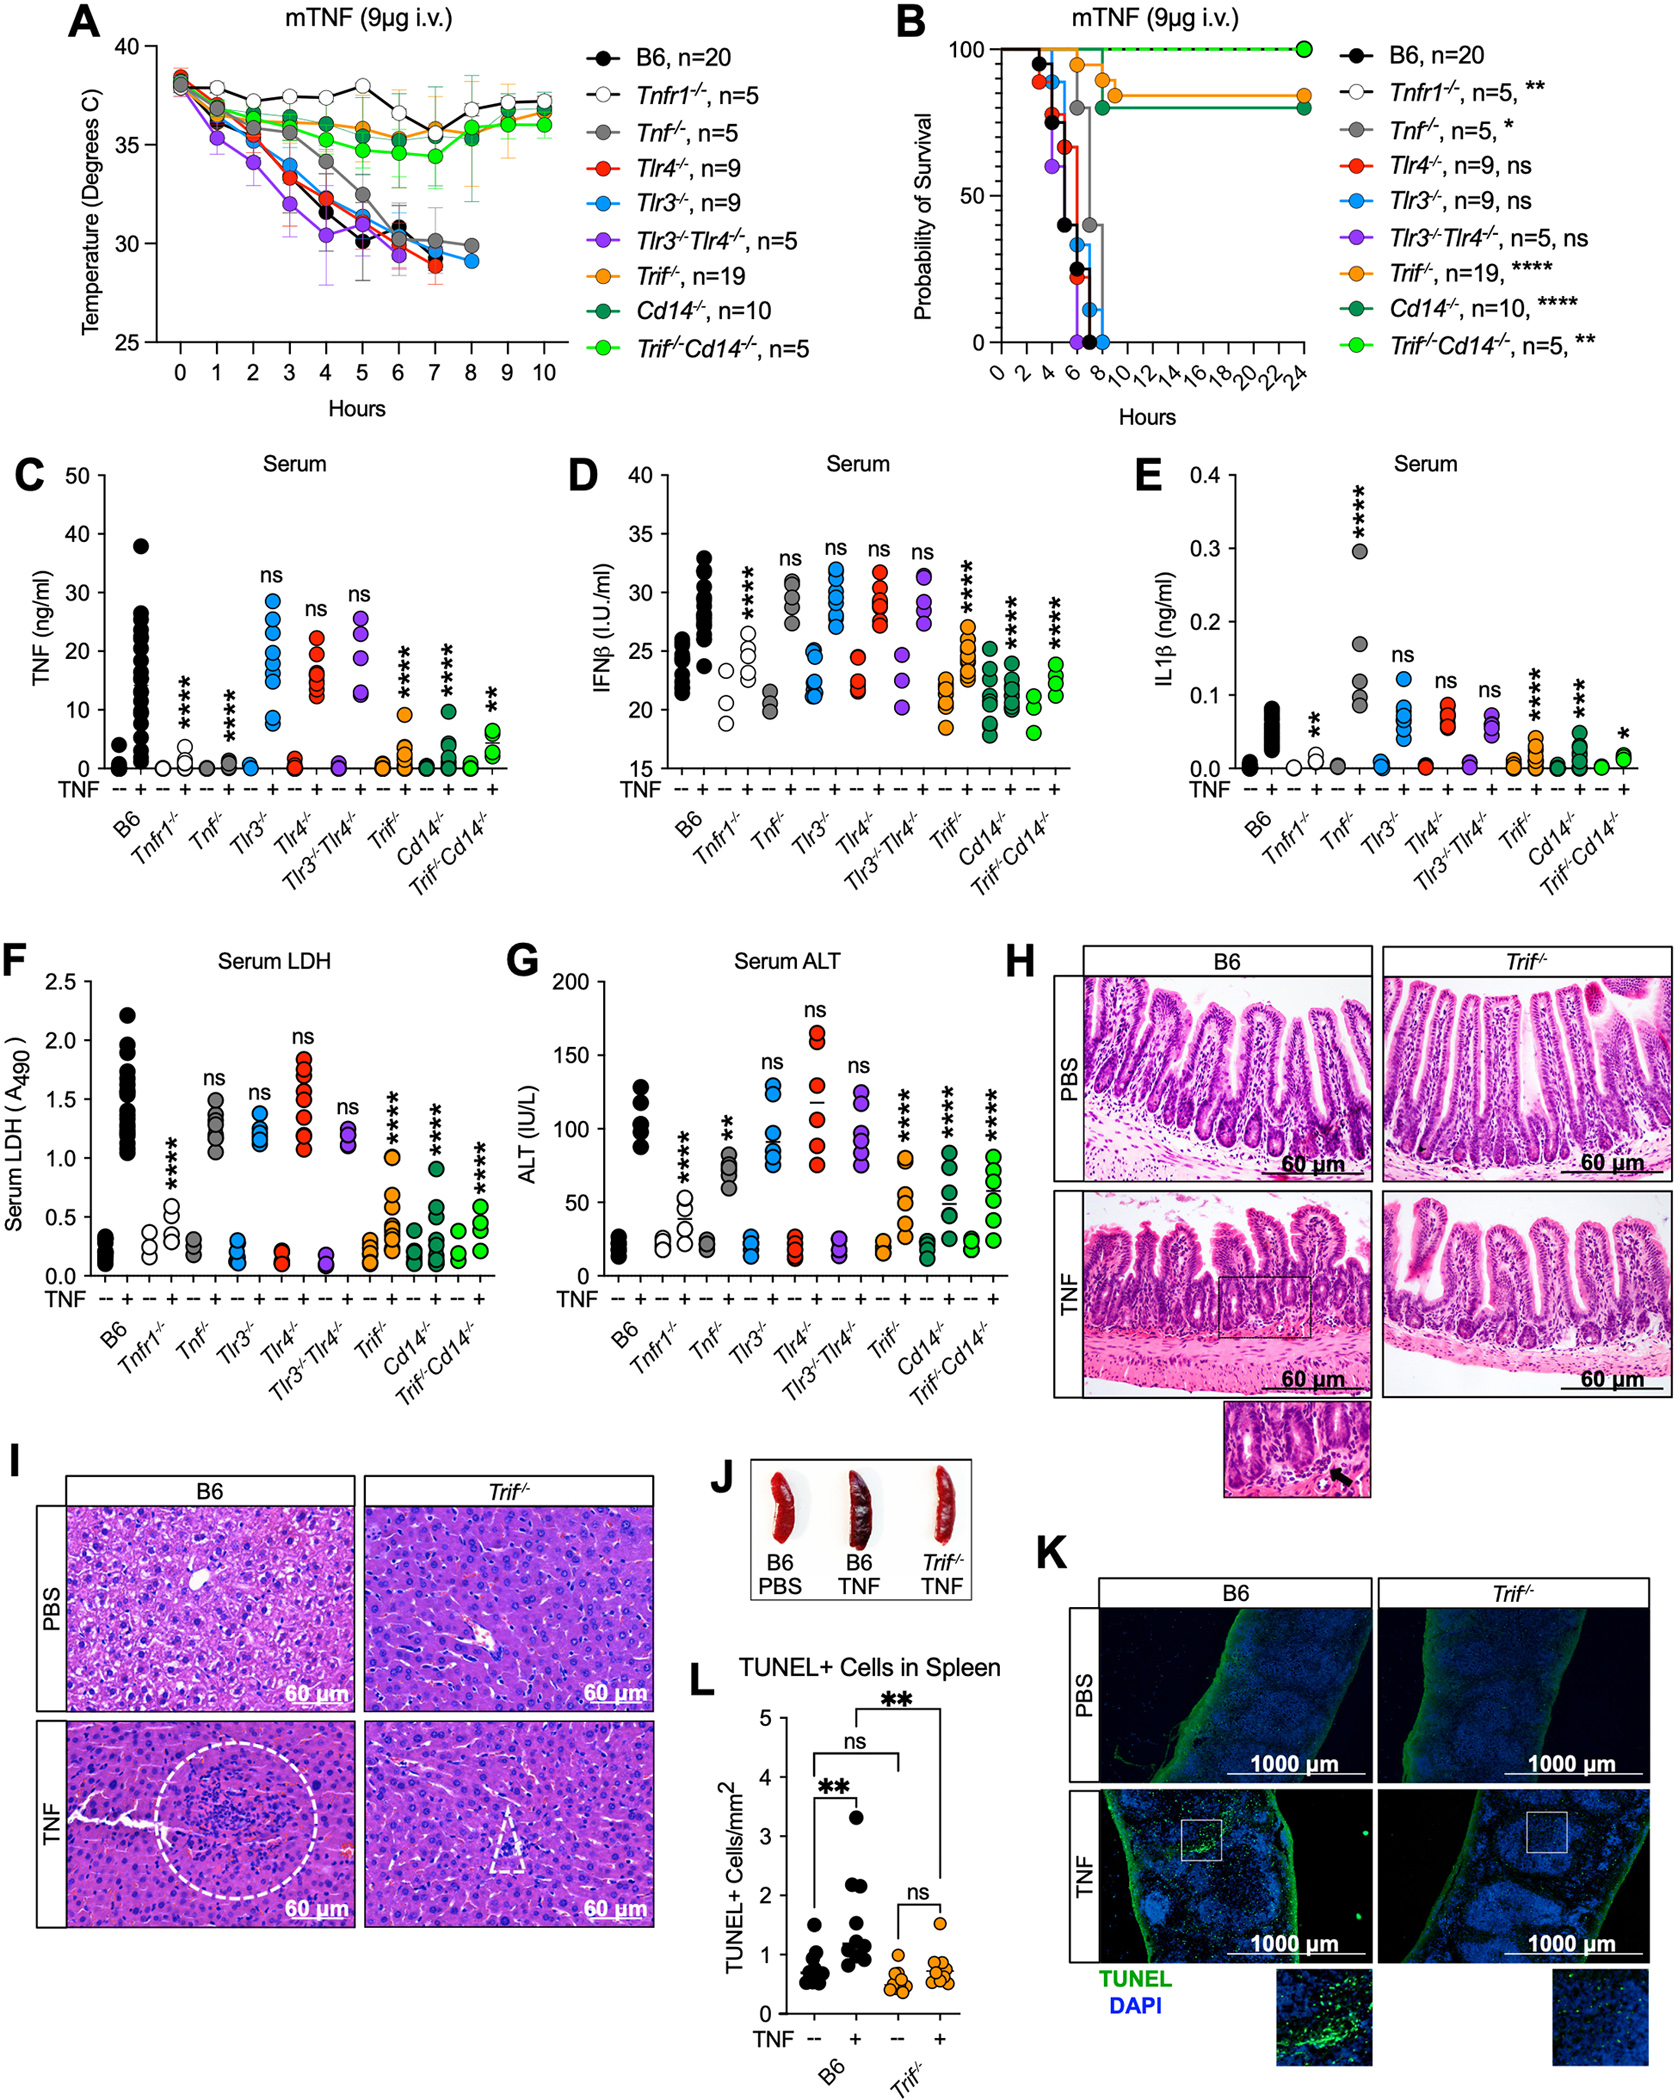
Fig. 3. TRIF and CD14 mediate TNF-induced lethality.

(A, B) Mouse body temperature (A) and survival (B) over time in B6, Tnfr1−/−, Tnf−/−, Trif−/−, Cd14−/−, Trif−/−Cd14−/− Tlr3−/−, Tlr4−/− and Tlr3−/−Tlr4−/− mice after intravenous injection with 9ug mTNF. (C-G) Serum levels of (C) TNF, (D) IFNβ, (E) IL-1β, (F) relative lactate dehydrogenase (LDH) and (G) Alanine Aminotransferase (ALT) in indicated mice 4 hours after i.v. injection with 9ug mTNF. Data points indicate individual mice tested (B6 PBS, n=13; Tnfr1−/− PBS, n=3; Tnf−/− PBS, n=3; Trif−/− PBS, n=10; Cd14−/− PBS, n=7; Trif−/−Cd14−/− PBS, n=3; Tlr4−/− PBS, n=6; Tlr3−/− PBS; n=9; Tlr3−/−Tlr4−/− PBS, n=3 B6 mTNF, n=22; Tnfr1−/− TNF, n=5; Tnf−/− TNF, n=5, Trif−/− mTNF, n=14; Cd14−/− mTNF, n=10; Trif−/−Cd14−/− TNF, n=5; Tlr4−/− mTNF, n=9; Tlr3−/− mTNF, n=9; Tlr3−/−Tlr4−/− TNF, n=5 ). (H, I) H&E staining of (H) ileum and (I) liver sections from B6 and Trif−/− mice 4 hours after injection with 9ug mTNF or PBS. Dotted boxes indicate areas of leukocyte recruitment. (J) Representative image of spleens from B6 and Trif−/− mice injected with 9ug TNF or PBS 6 hours after injection. (K) TUNEL staining and (L) quantification of TUNEL+cells/mm2 in the spleen of B6 and Trif−/− mice 4 hours after injection with 9ug mTNF. Each point represents 1 field of view across 3 biological replicates. Analysis of variance (ANOVA) was used for comparison between groups: ns, nonsignificant (p>0.05); *p<0.05; **p<0.01; ***p<0.001; ****p<0.0001.
