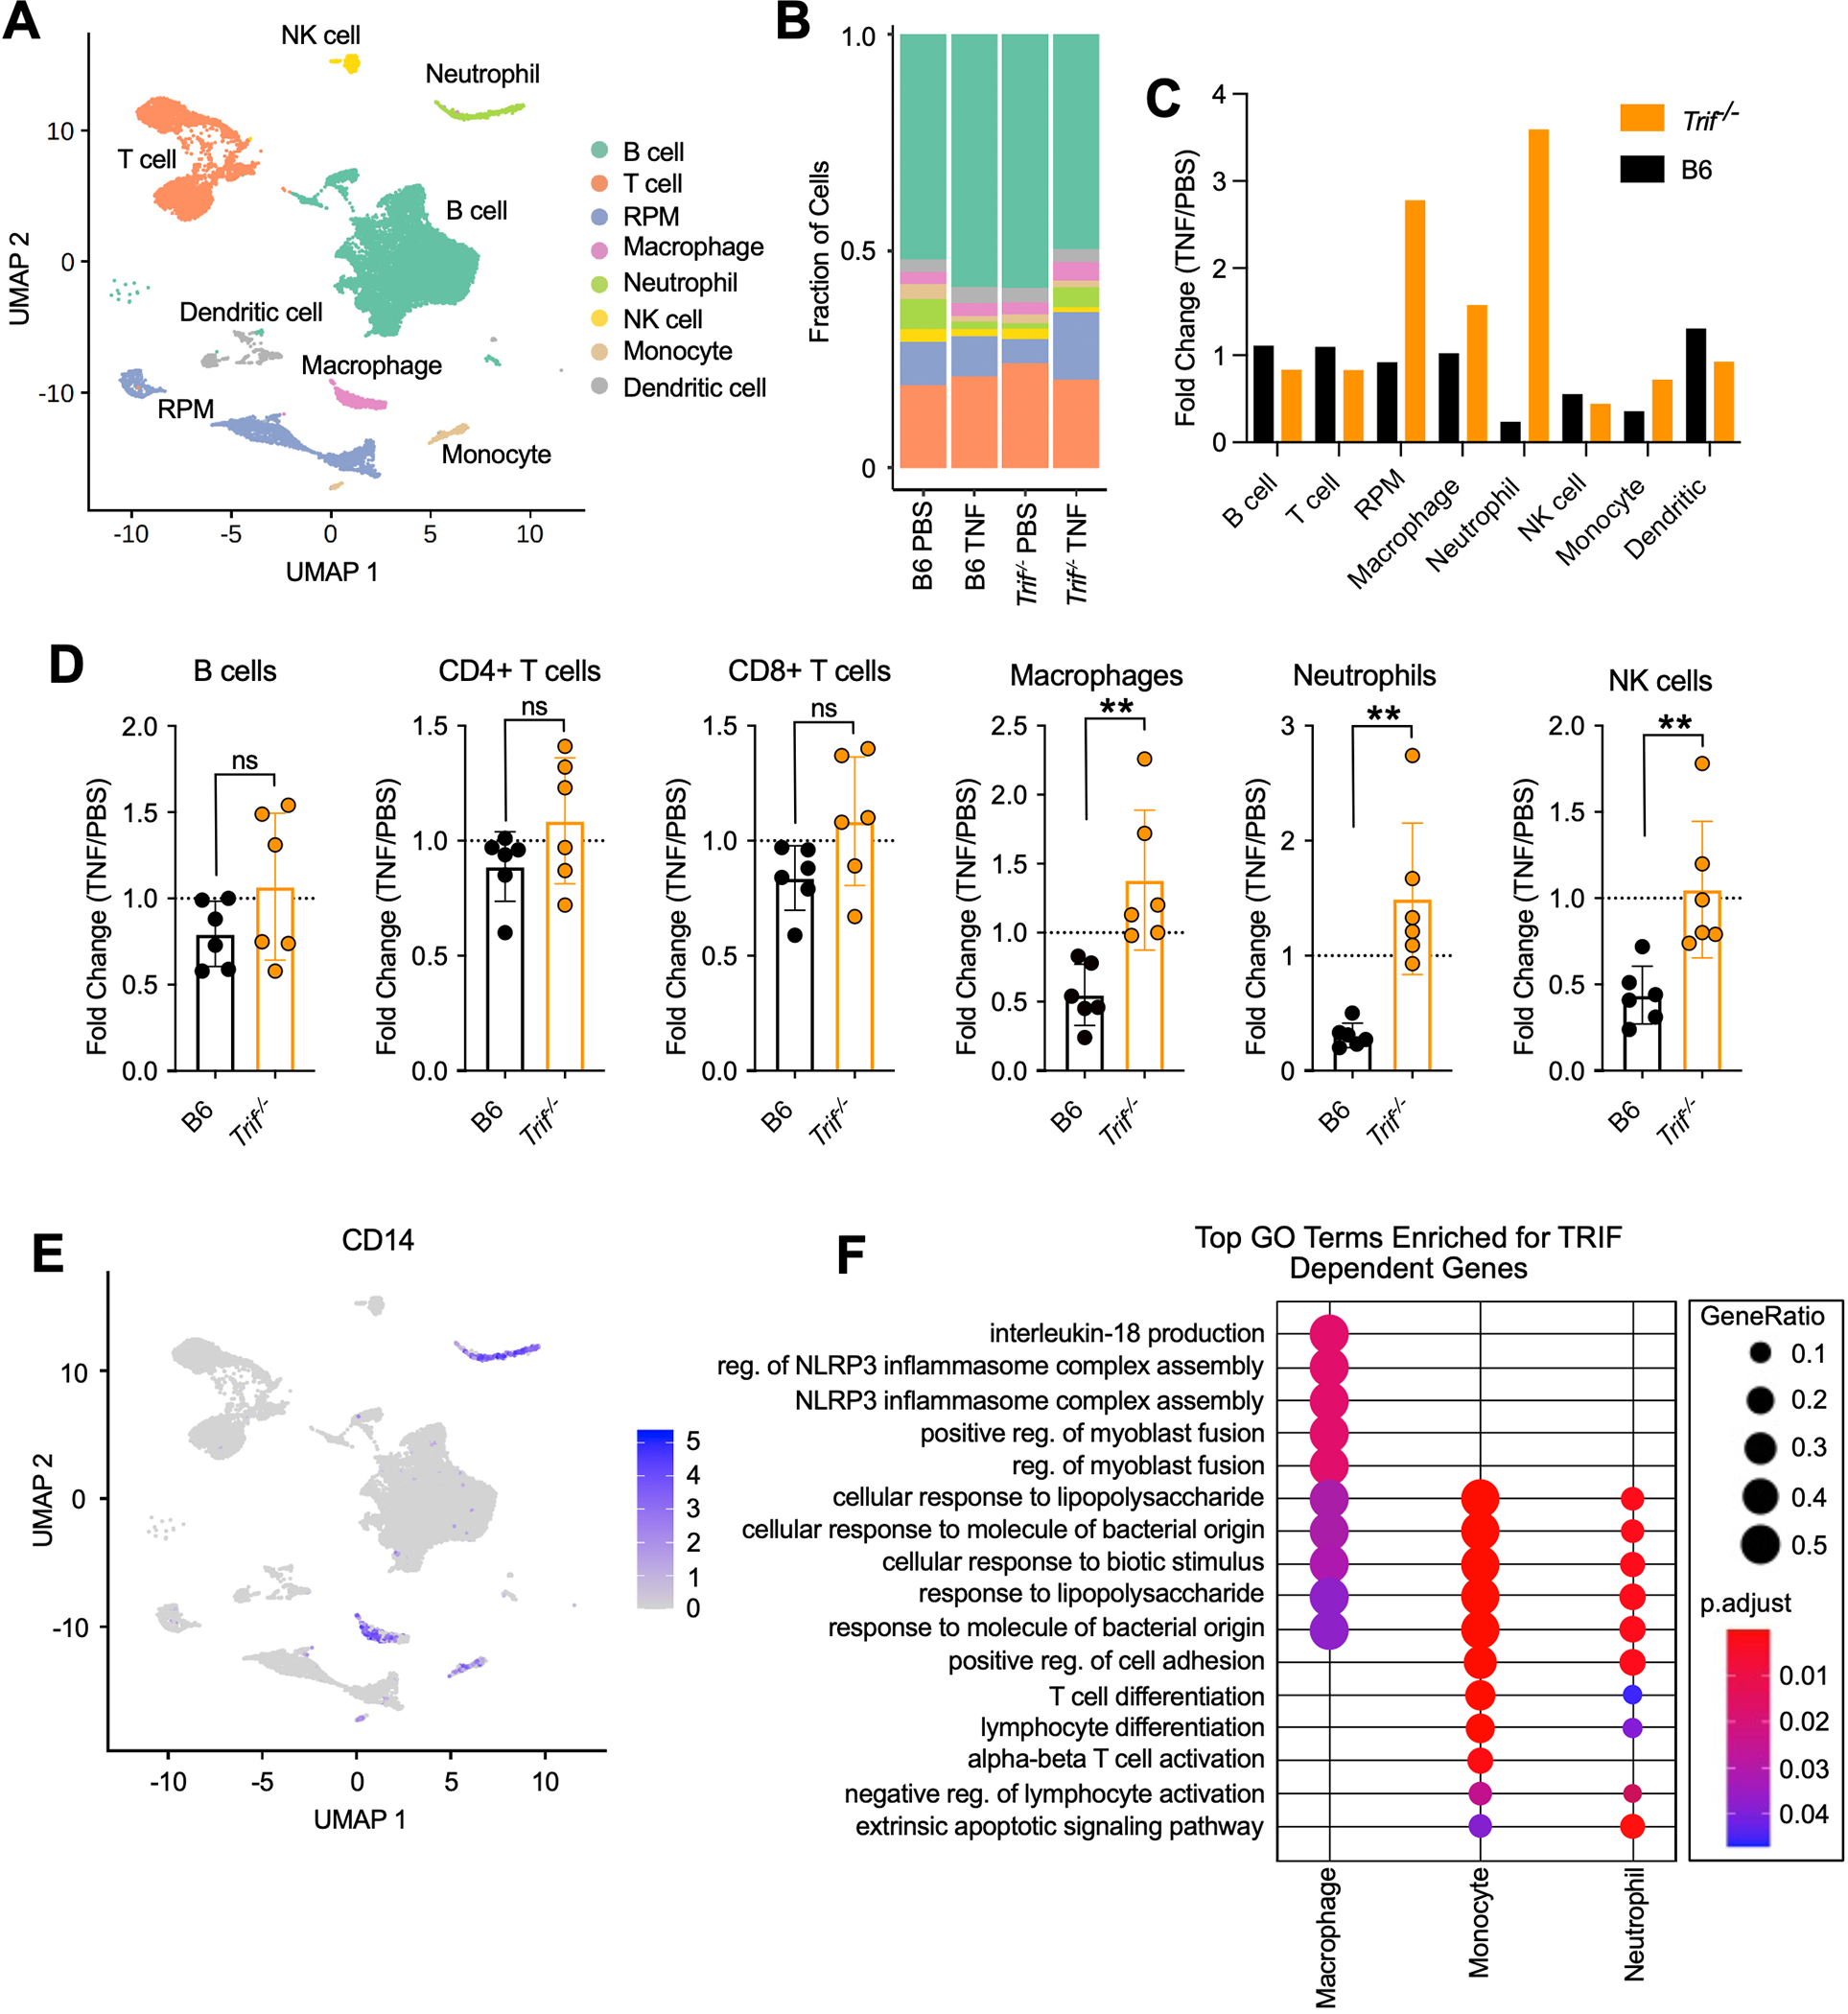
Fig. 4. A cell-specific requirement for TRIF in the regulation of immune responses to TNF.

(A) UMAP of splenocytes from B6 and Trif−/− mice 4 hours after intravenous injection with 9ug mTNF or PBS. Colors represent cell type annotations. (B) Fraction of cells corresponding to each cell type annotation in B6 and Trif−/− mice 4 hours after intravenous injection with 9ug mTNF or PBS. (C) Fold change (TNF/PBS) in proportion of cells corresponding to each cell type annotation in B6 and Trif−/− mice 4 hours after intravenous injection. (D) Fold change in the number of immune cells in the spleen 4 hours after injection with TNF compared to PBS in B6 and Trif−/− mice. Data points indicate individual mice tested (B6 TNF, n=6; Trif−/− TNF, n=6). Bars represent the mean ± SD. Analysis of variance (ANOVA) was used for comparison between groups: ns, nonsignificant (P>0.05); *P<0.05; **P<0.01; ***P<0.001; ****P<0.0001. (E) UMAP showing CD14 expression in splenocytes from B6 and Trif−/− mice. (F) Top Gene Ontology (GO) Biological Process categories enriched for genes that were significantly upregulated in B6 mice in response to TNF, but significantly less upregulated in Trif−/− mice in indicated cell types. GeneRatio: The ratio of the number of genes in the query set that are annotated by the GO ID and the number of genes in the query set that are annotated in the database of all GO IDs. p.adjust calculated using the Benjamini-Hochberg method.
