
Fig 1. HIV-1 Pol gene maximum likelihood trees.
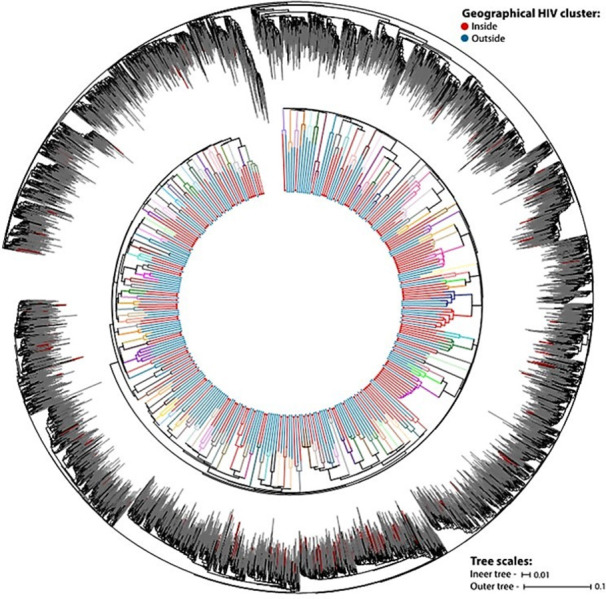
The outer tree shows the identification of the target phylogenetic transmission cluster (red branches) in a background of a control dataset with sequences from Southern African countries (gray branches). The inner tree depicts the identified clusters (in different colors) and the geographical location of the sampled individuals (according to the legend at the top right).