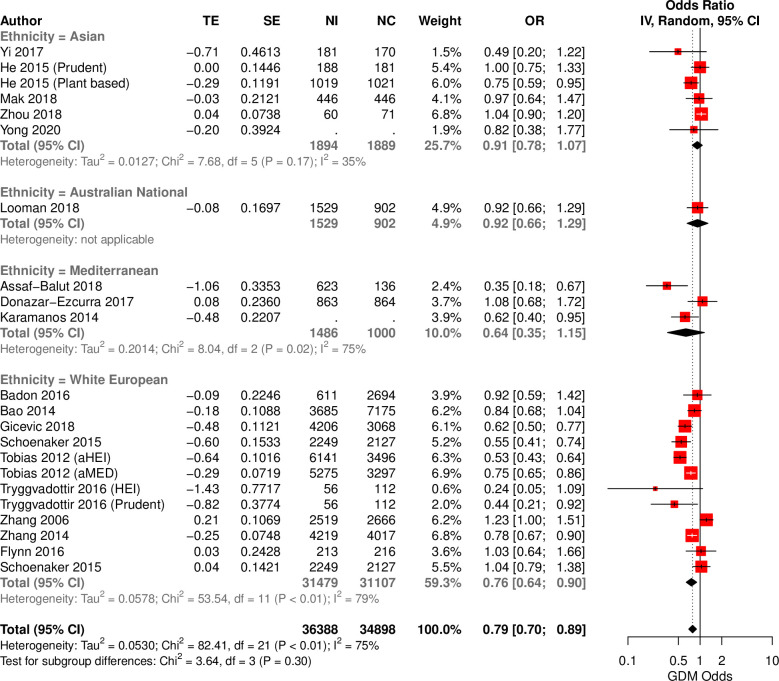
Fig 3. Forest plot of reported associations between healthy dietary interventions and odds of GDM in ethnically–defined observational studies.
Forest plot illustrating the association between habitual healthy dietary intake and GDM in distinct ethnicities. TE: treatment effect, SE: standard error, IV: inverse variance method, CI: Confidence interval.

