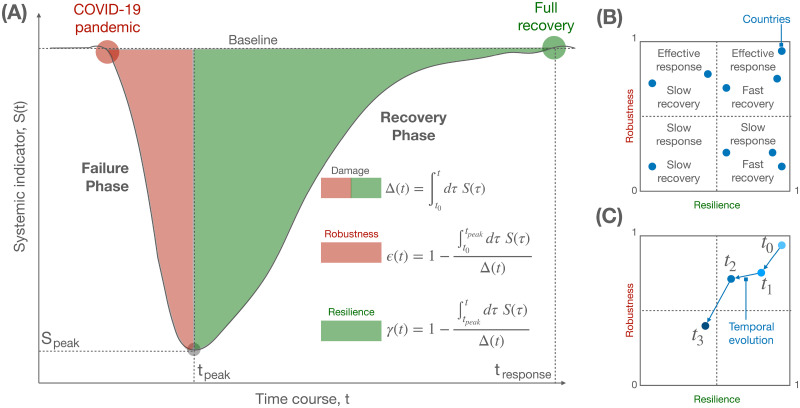
Fig 1. Modeling the response of a complex system to a shock.
(A) Schematic of changes in a complex system—e.g., the economy of a country—as quantified by a systemic indicator—e.g., the change in GDP growth (see the text for details)—undergoing a decrease, corresponding to a failure phase, and an increase, corresponding to a recovery phase, after a shock like COVID-19. The shaded areas under the curve allow to define a measure of robustness and resilience, which can be used to quantify the response of a country. (B) The two indices are scattered to define 4 distinct types of response within a fixed temporal window, combining effective or weak robustness with fast or slow resilience. (C) Similar to (B), but considering the temporal evolution of the two indices for a given country, allowing to monitor the trend of the system over time.

