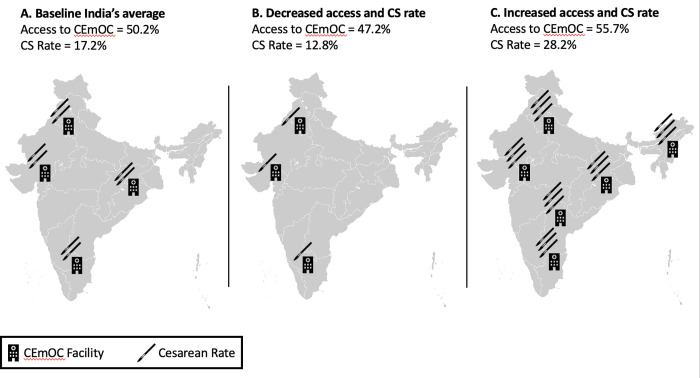
Fig 1. Strategies to scale up CS care.
Graphic representation of the three strategies: [A] is the baseline strategy with India’s national average access to CEmOC and average CS rate; [B] is the strategy that reflects India’s current access to CEmOC and CS rates in rural areas, which are poor and adequate, respectively; [C] is the strategy that reflects India’s current CEmOC access and CS rates in urban areas, which have better access to CEmOC than the average and a higher CS rate than the rest of India. The facilities icon represent access to CEmOC, and the scalpels represents CS rate. The icons are a visual representation and do not illustrate proportional changes between the strategies. Base Layer from: https://commons.m.wikimedia.org/wiki/File:BlankMap-India2.92.png.

