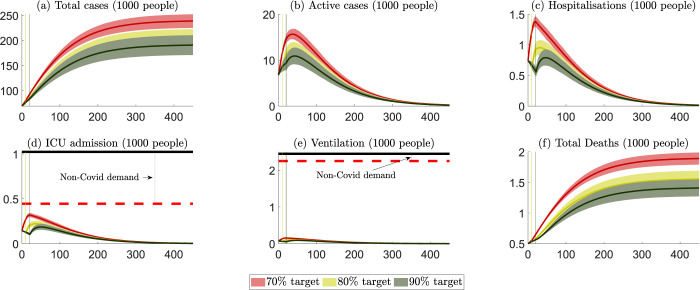
Fig 2. NSW: Projected public health outcomes after opening up.
Notes about Fig 2: 1. Day zero is specified to be 11 October 2021. 2. The red, yellow, and green colours represent scenarios where lockdowns are removed after the 70%, 80% and 90% targets, respectively. 3. The (red, yellow, and green) vertical lines represent the days when the 70%, 80% and 90% targets are reached. 4. The (red, yellow, and green) curves represent the mean of all projection outcomes, and the bands represent their 95% confidence intervals. 5. The black horizontal lines in panels (d) and (e) are the capacity of the health care system, i.e., staffed ICU beds and ventilators (data sources reported in S1 Text). 6. The red horizontal dashed lines in panels (d) and (e) are the net capacity of the non-COVID19 ICU and ventilation demand, which are estimated via the occupation rates of ICU beds and ventilators in 2018/2019 (data sources reported in S1 Text).

