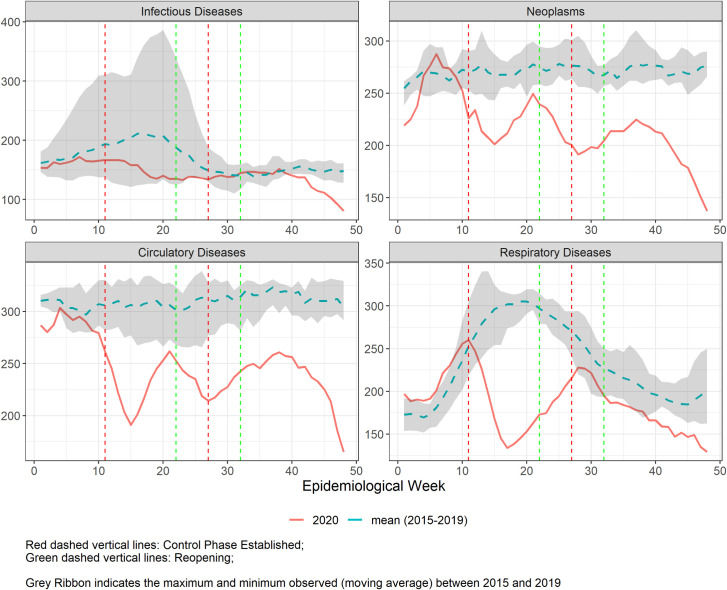
Fig 2.
Five-week moving average of number of hospital admissions in Belo Horizonte during the COVID-19 pandemic from epidemiological weeks (EW) 1–48, 2020 (solid line), compared to the mean of 2015–2019 (dashed line), for the 4 selected disease groups. Vertical lines refer to the weeks of control (red) and reopening phases (green).

