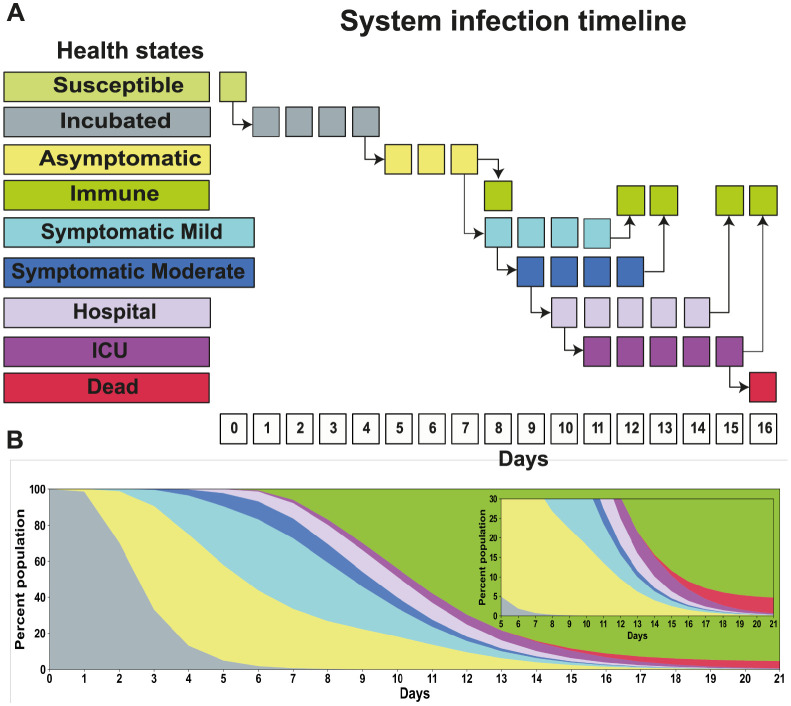
Fig 1. Timeline of agent’s health state progression through a SARS-CoV-2 infection.
(A) Possible daily transitions of one agent starting from Susceptible up to Dead or Immune. Sequences of the same state represent average time without change. (B) The evolution of the state of 10,000 agents, with age and sex distribution suited to the City of Natal, turned into Incubated at day zero. The simulation assumes illimited ICU bed availability.

