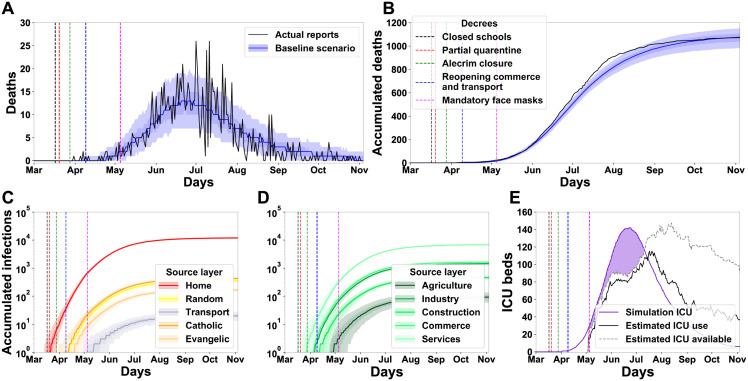
Fig 5. Baseline simulation from the agent model provides a good fit for epidemiological data on the first wave of the SARS-CoV-2 epidemic in the City of Natal, Brazil.
(A) Daily and (B) accumulated deaths during the first wave of the SARS-CoV-2 outbreak in the City of Natal (from the end of February to the beginning of October) from simulation (blue) and actual reports (black). Vertical lines indicate the dates of publication of governmental decrees. (C and D) The accumulated number of infections originated in each layer or sub-layer. Simulation data from (A to D) were reported as median and quartiles (5%, 25%, 75%, 95%) from 500 runs. (E) Model-predicted ICU requirement (solid purple line, median) and excess (purple area) from estimated daily availability (silver dashed line) and the actual estimated occupation (black line) of ICU beds for the City of Natal.

