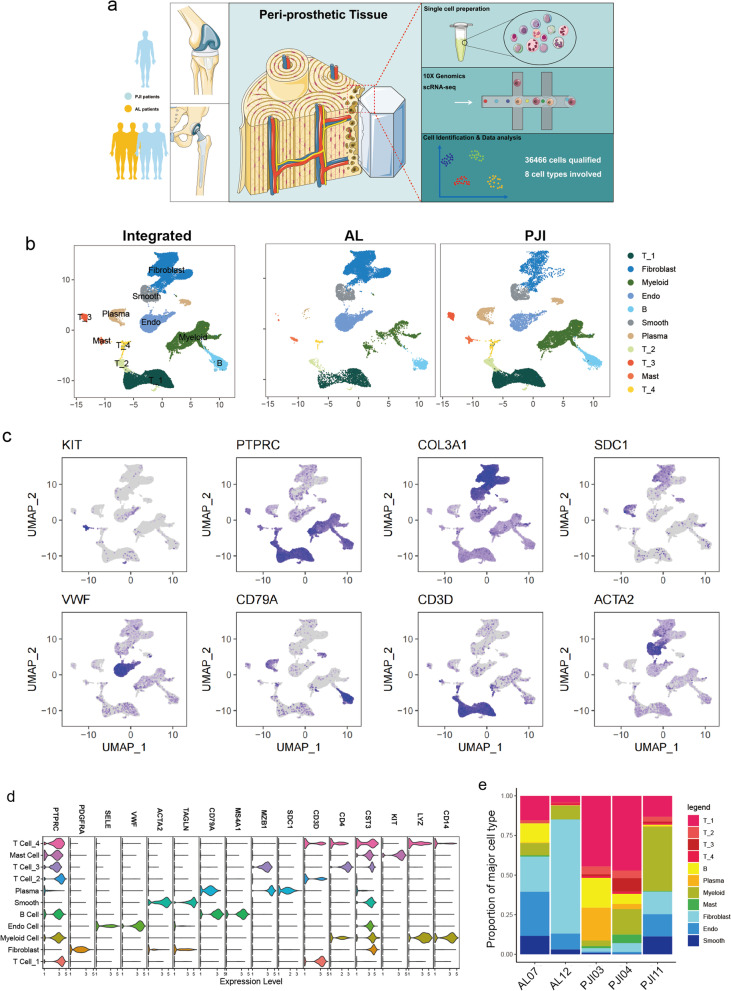
Fig. 1.
Single-cell RNA sequencing reveals cell heterogeneity in the periprosthetic environment. a Schematic overview showing study workflow from sampling to single-cell sequencing and data analysis. b UMAP visualization of total cells from the periprosthetic tissue of patients with AL and PJI, single cells are colored by cluster annotation. c Colored UMAP plot showing marker genes for each type of cell. d Violin plots showing the selected canonical marker genes across the annotated cell clusters. Expression levels are normalized and log transformed. e Stacked bar plot showing proportions of annotated cell clusters in each sample

