Fig. 2.
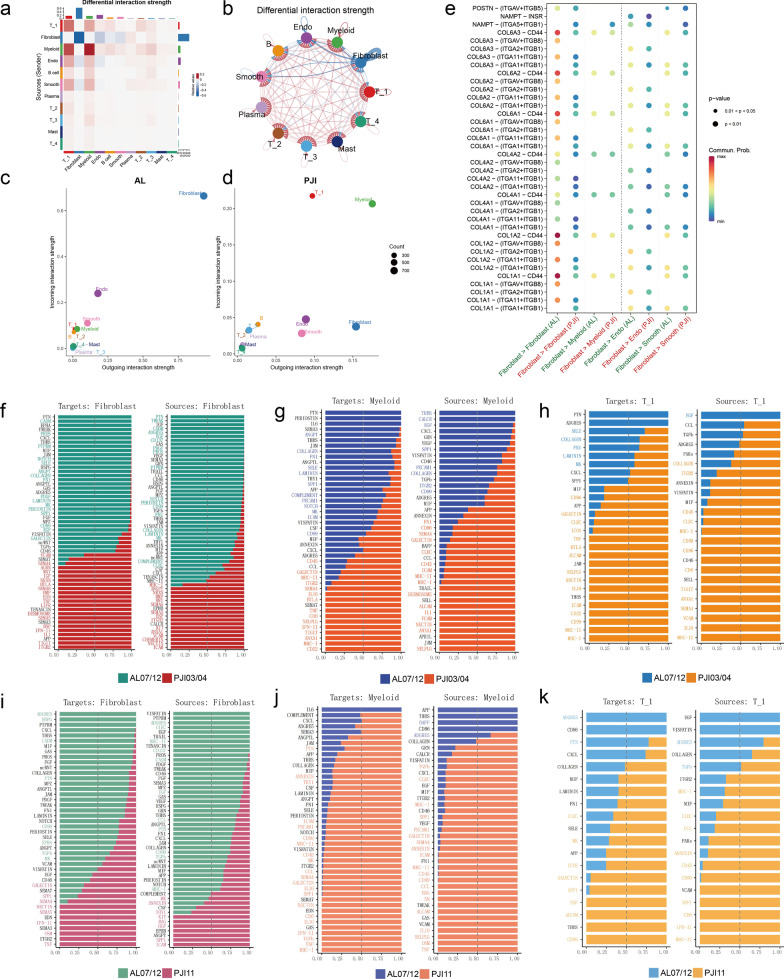
Cell–cell interaction analysis reveals differences in the major mediators between AL and PJI. a, b Heatmap and circos plot shows differential interaction strength relative to PJI, red indicates increased interaction strength and blue indicates decreased strength in PJI. c, d Scatter plot shows incoming interaction strength (y-axis) and outcoming interaction strength (x-axis) for each cell cluster in AL (c) and PJI (d) samples. e The dotted heatmap shows major differentially expressed ligand-receptor pairs in AL and PJI groups. f–k Bar plots list the relative strength of pathways from and target to Fibroblasts (f, i)/Myeloid cells (g, j)/T_1 cells (h, k)

