Fig. 3.
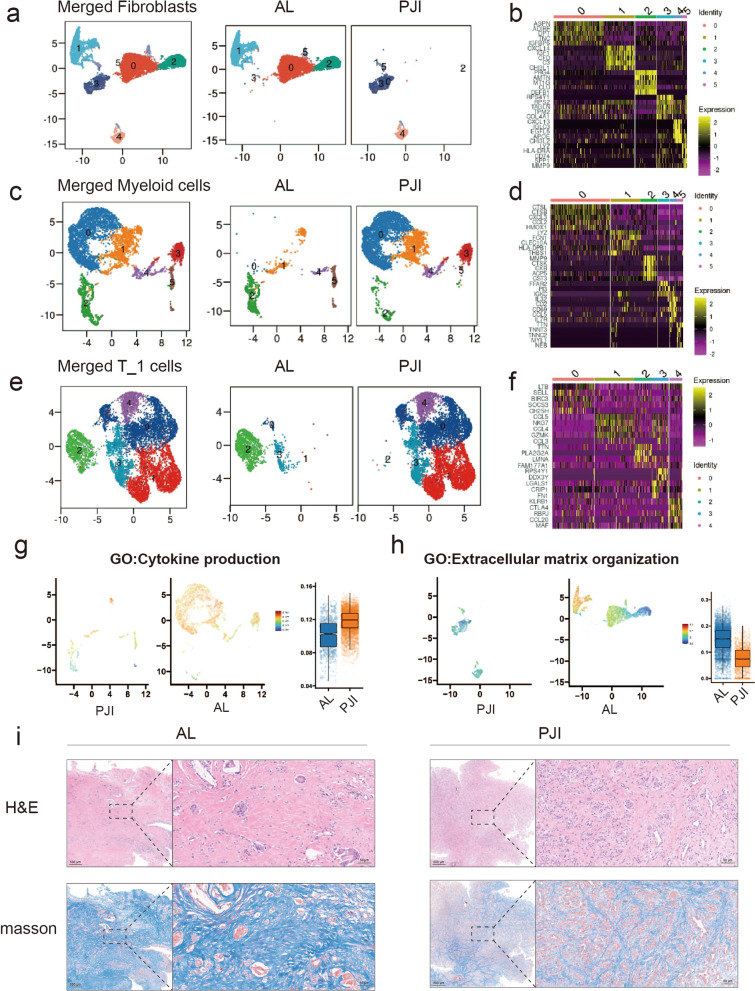
Fibroblast, myeloid cells and T_1 cells subtype analysis revealed cell functional differences. a, c, d UMAP visualization of fibroblasts (a)/myeloid cells (c)/T_1 cells d from the periprosthetic tissue of patients with AL and PJI, cells are colored by subtypes. b, d, f Heatmap displayed the highly expressed marker genes for each fibroblast (b)/myeloid cell (d)/T_1 cell (f) subclusters. g AUCell quantification of Gene ontology term for Cytokine production in myeloid cells. h AUCell quantification of Gene ontology term for extracellular matrix organization in fibroblasts. i Images of HE and Masson staining results for AL and PJI samples

