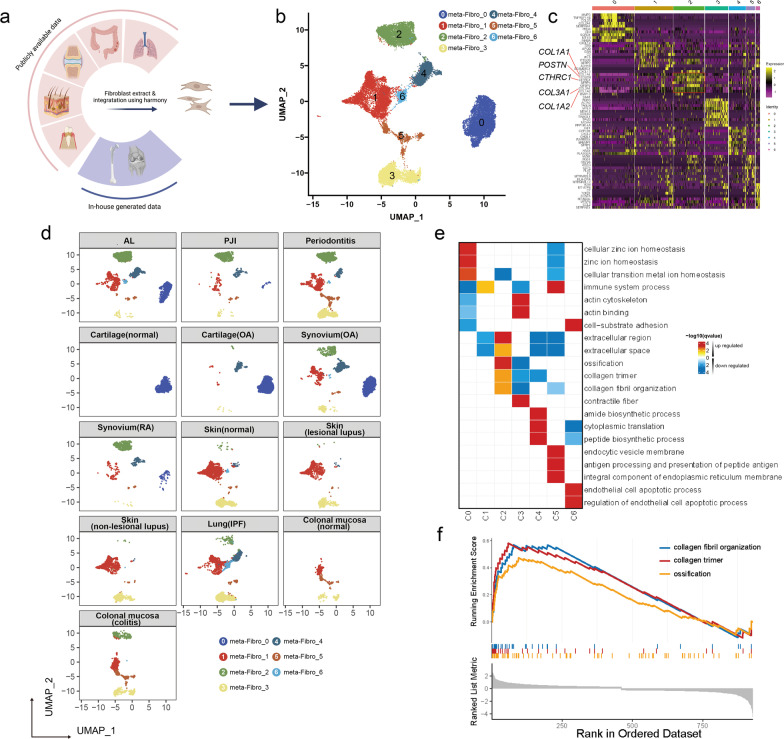
Fig. 4.
Meta-analysis of human fibroblast scRNA-seq data. a Illustration of the selected scRNA-seq data from GEO publicly available database. scRNA-seq derived from different organs were acquired from the GEO database and integrated with the in-house generated scRNA-seq data, then fibroblast scRNA-seq was extracted for further meta-analysis. (b) UMAP visualization of the fibroblast, cells are colored according to cell meta-clusters. c Heatmap displayed the highly expressed marker genes for each fibroblast meta-clusters. d UMAP visualization of the fibroblast in each sample. e The heatmap shows the GSEA enrichment result for each of the fibroblast cell meta-clusters. GO:BP databases were used in this analysis. f GSEA results shows three GO terms (ossification, collagen trimer, collagen fibril organization) are enriched in the fibroblast meta-cluster 2

